English
/
2025 Crypto Recap: From Niche to Institutional
Share:
The crypto market underwent a structural transformation in 2025. ETFs, stablecoins, and RWAs redefined access to digital assets, while institutions formally entered the ecosystem, reshaping the market structure. This is the start of a repricing cycle as digital assets converge with TradFi and adoption. This recap highlights the key narratives, sectors, and projects that drove the shift.
Recap
Jan 7, 2026
27 min read
by CryptoRank
Share:
Key Takeaways:
- In 2025, Bitcoin and Ethereum traded less as reflexive crypto assets and more as macro-sensitive instruments, with price action increasingly shaped by liquidity conditions, regulation, and institutional positioning rather than internal network dynamics.
- DATs temporarily strengthened crypto demand by turning equity-market access into token exposure, but the model remains structurally unstable under premium compression, tighter funding, or regulatory shifts.
- DeFi shifted away from user-driven activity toward lending- and yield-centric protocols, where TVL growth is increasingly driven by leverage loops, collateral reuse, and predictable returns rather than real transactional demand.
- Altseason failed to materialize as capital fragmented across narratives, supply dilution intensified, and institutions prioritized large-cap, regulated exposure over high-risk tokens.
- The resurgence of prediction markets in 2025 was driven less by crypto-native demand and more by regulatory normalization and fintech distribution, turning them from speculative toys into institutionally tolerable information markets.
- Perp DEX growth revealed that trader liquidity is structurally mercenary, with volumes flowing to fee rebates and incentives rather than product differentiation, making retention—not acquisition—the core competitive bottleneck.
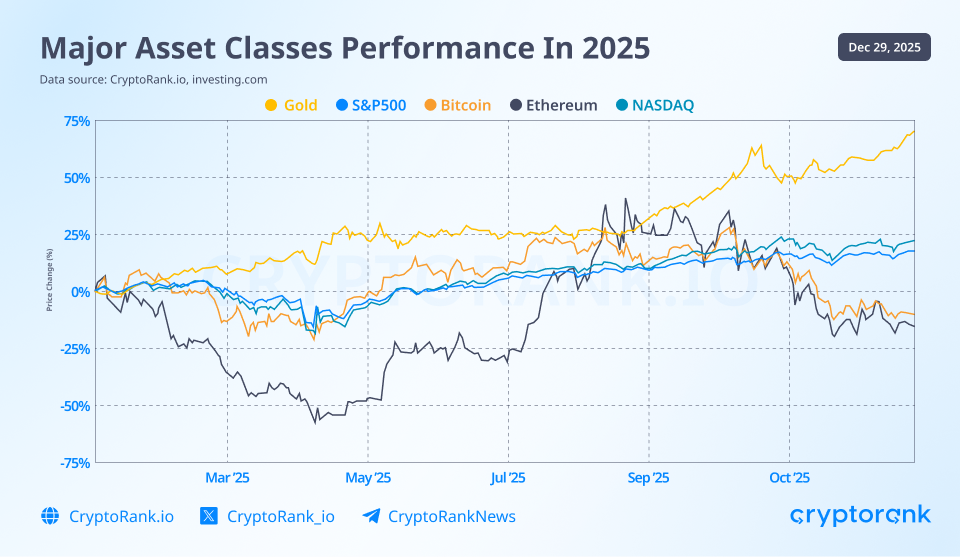
Global Assets Performance Overview
As crypto becomes increasingly integrated into the global financial system, analyzing it in isolation falls short. Ignoring the performance of global benchmark assets like gold and the US equities leads to a distorted view of liquidity cycles, risk preferences, and capital allocation that ultimately drive crypto markets.
Data source: CryptoRank API
Gold
From a macro perspective, 2025 is defined by an exceptional surge in precious metal prices. Gold’s 2023–2025 rally is not a cyclical commodity move but a demand-driven repricing of monetary risk. Over two years, gold gained roughly 150% while mine supply grew by less than 2% annually.
Central banks purchased more than 1,000 tonnes in 2024 and continued accumulating in 2025, reallocating reserves away from dollar assets as real yields softened after their 2023 peak and fiscal deficits widened.
With gold’s market capitalization reaching $31.2T, the move reflects sovereign and institutional balance-sheet decisions rather than speculative leverage.
S&P 500 and NASDAQ
In 2025, the US stock market posted strong but uneven gains, with a sharp April drawdown triggered by Trump’s tariff policy, followed by a steady recovery led by tech companies into year-end. The S&P 500 finished the year up +17.8% on a price basis and +19.3% including dividends. This extended the rally to roughly +80% since the start of 2023, making 2025 the third consecutive year of double-digit returns. The growth was mainly driven by megacap tech stocks and AI-exposed companies, while the rest of the index lagged behind.
The Nasdaq Composite and Nasdaq-100 outperformed the S&P 500, ending the year up 22% amid sustained capital concentration in highly speculative sectors, such as AI, semiconductors, cloud infrastructure, and high-growth tech.
Overall, 2025 showed a clear transition from risk aversion in Q1-Q2 to a liquidity-supported, tech-dominated bull phase in Q3-Q4, driven by expectations of easier monetary policy and resilient earnings. Unlike gold’s move, which reflects hedging against monetary risk, US equities in 2025 priced growth optimism through narrow but powerful tech-sector leadership tied to AI adoption.
Meanwhile, the gap between the real economy and financial markets has widened materially. The Buffett Indicator, which shows the ratio of total US equity market capitalization to GDP, is now exceeding two standard deviations above its long-term trend. This level may indicate significant equity market overvaluation.
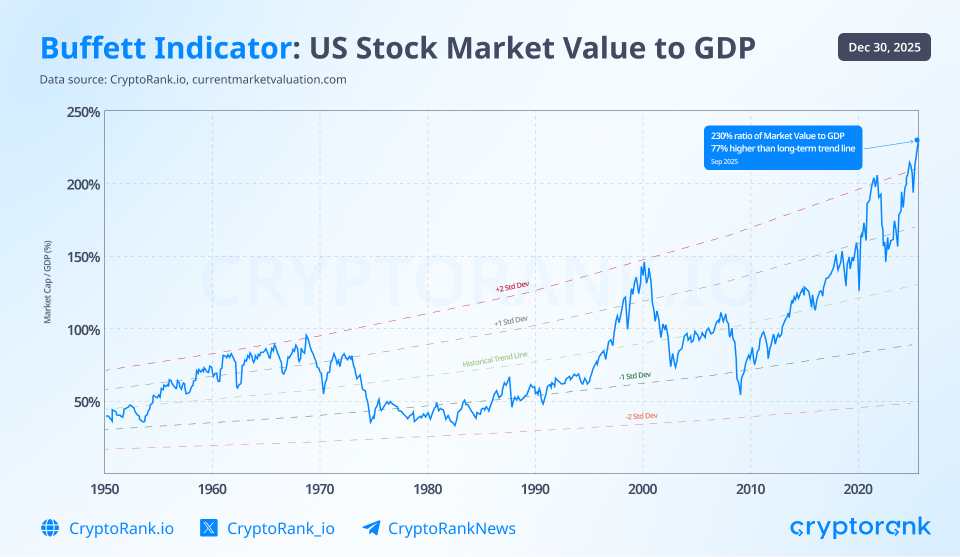
Given possible equity overvaluation, part of the gold rally reflects hedging against overheated US stocks. The open question is how this equity market overheating transmits to Bitcoin and the broader crypto market: whether crypto absorbs excess liquidity as a higher-beta risk asset, or increasingly behaves as an alternative hedge when confidence in traditional asset pricing weakens.
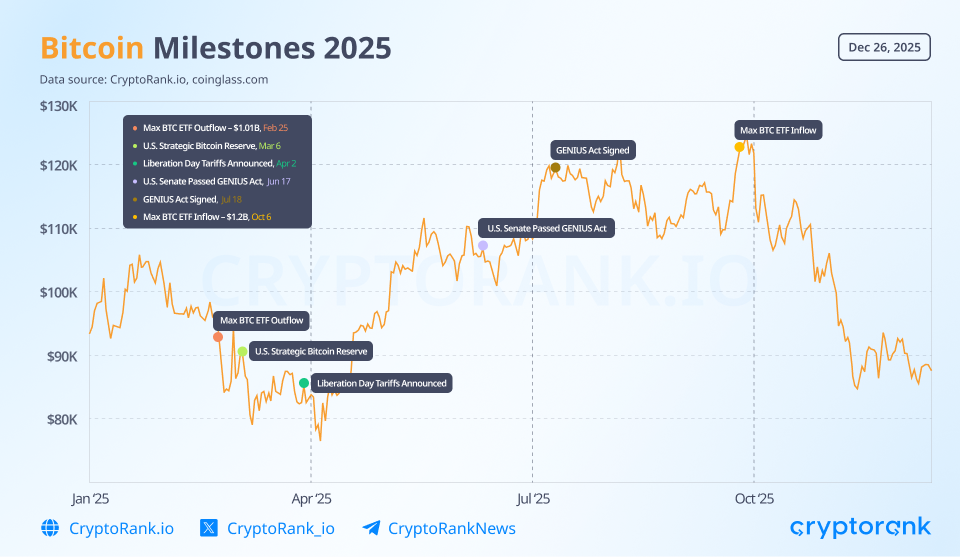
Bitcoin
In 2025 Bitcoin’s price action was much more fluctuative and macro-linked than in previous cycles, marking a departure from speculative momentum toward an asset influenced by institutional flows, regulatory milestones, and broader risk sentiment. Bitcoin climbed to new all-time highs above $126K, driven by spot ETF inflows, strategic reserve narratives, and dovish rate expectations. However, it did not sustain that peak, pulling back into the $80K–$90K range by year-end.
Data obtained by API
At the end-of-year price nears 90K, Bitcoin posts a slightly negative annual return. This suggests Bitcoin may be acting as a forward-looking, higher-volatility indicator of equity market stress rather than participating in the prevailing risk-on regime. If that interpretation proves wrong, BTC price would be expected to move higher, pulled by the momentum and liquidity tailwinds driving both US equities and gold.
Unlike prior years where steep rallies were driven by retail and leveraged inflows, 2025’s narrative was structural adoption colliding with macro factors: ETF flows, regulatory clarity, and strategic reserve proposals (including national and state-level initiatives) added legitimacy but did not prevent deep drawdowns from cycle highs.
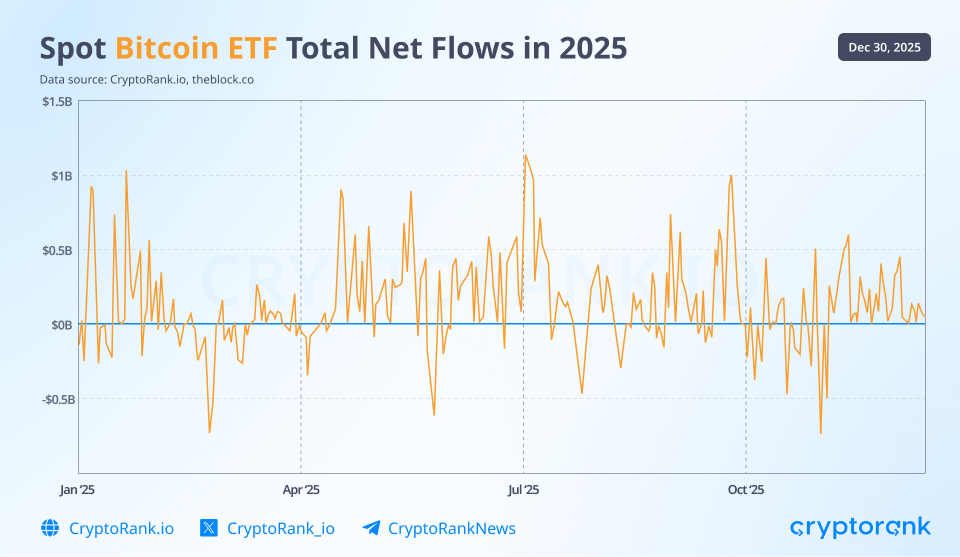
Spot Bitcoin ETFs attracted tens of billions in cumulative inflows even as short-term performance lagged, and corporate treasuries continued strategic accumulation.
The result was a mixed performance profile. Bitcoin reached cycle highs that outpaced most risk assets early in the year, peaking in August following record ETF inflows after the signing of the GENIUS Act and other major crypto-related legislation. Consistent with a classic “buy the rumor, sell the news” dynamic, Bitcoin then spent the remainder of the year in decline.
Ethereum
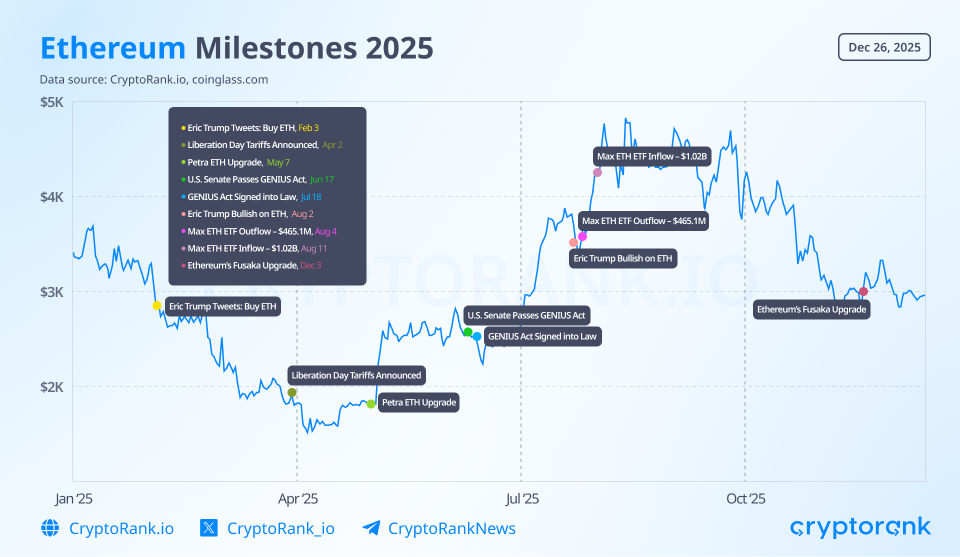
Unlike Bitcoin, whose 2025 performance showed relative resilience, Ethereum remained highly volatile, although its price dynamics were shaped by the same macro triggers. After starting the year above $3,000, ETH experienced sharp drawdowns, falling to multi-year lows near $1,500 in April 2025 amid Trump’s tariff policy and the broader market sell-off. It then rallied later in the year, briefly reaching a new all-time high above $4,900 in August, before retracing toward $3,000 by year-end, broadly following the same “buy the rumor, sell the news” pattern observed in Bitcoin.
Data source: CryptoRank API
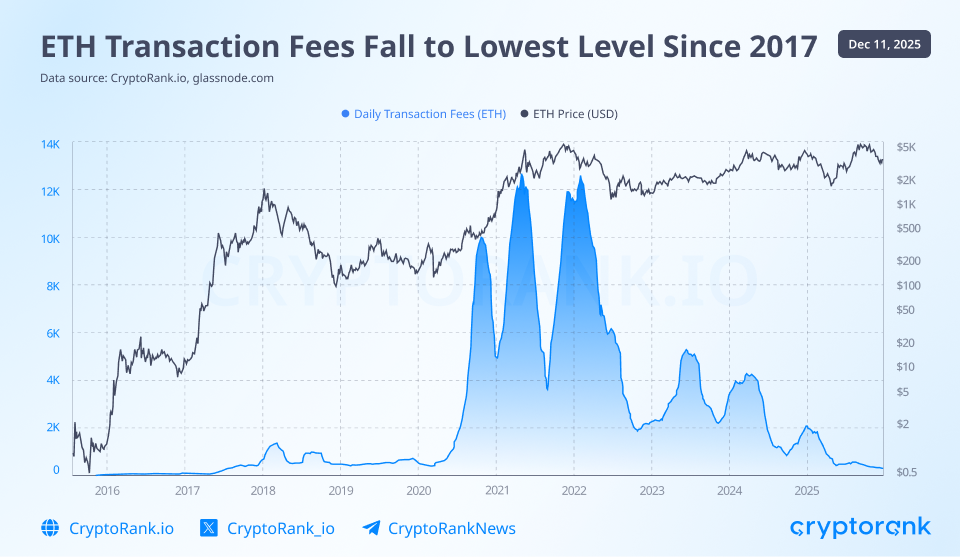
Behind the price, on-chain data reflects structural progress driven by two major Ethereum upgrades in 2025: Petra and Fusaka. These upgrades improved execution efficiency, validator reliability, and rollup data availability, improving Ethereum’s qualities as a settlement layer for L2s. As a result of these updates, average gas fees fell to their lowest levels since 2017, signaling a meaningful improvement in network efficiency.
Ethereum’s market adoption metrics continued to improve in 2025. Daily active addresses, TVL, and stablecoin supply on Ethereum all trended higher, indicating sustained fundamental development despite price volatility. Ethereum remained the primary settlement layer for DeFi, and upcoming protocol and application-level upgrades are likely to further strengthen its role within the decentralized financial system in the coming years.
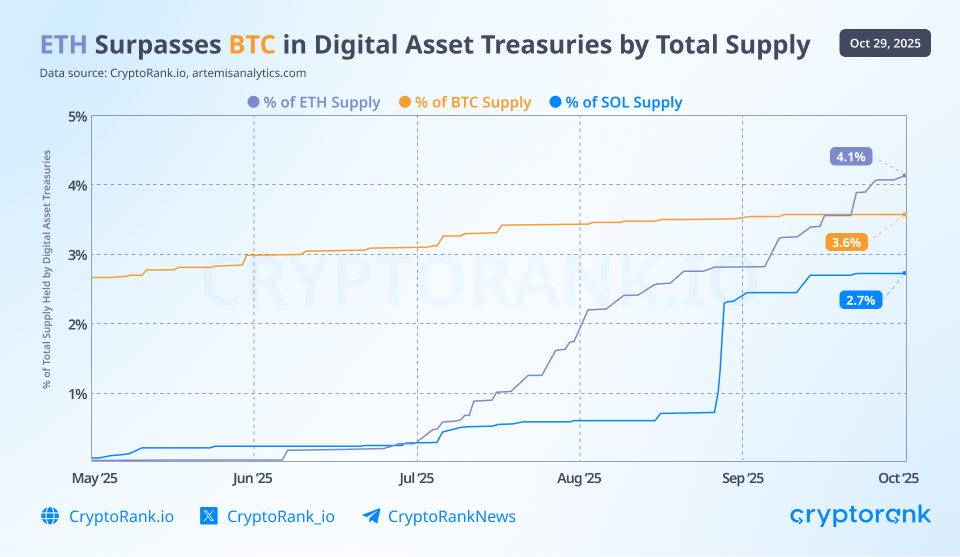
Digital asset treasuries are becoming a meaningful driver of ETH price formation. Their share of ETH supply rose from under 1% in July to over 4% by October, surpassing the proportion of BTC held by comparable treasuries.
ETH treasury companies are employing strategies such as staking and DeFi yield, offering potential non-dilutive returns on treasury capital that BTC-only strategies cannot accomplish.
DATs: A Powerful New Crypto Bid With Structural Risks
Beyond Ethereum and Bitcoin, DATs have begun to emerge aggressively for other tokens. Unlike ETFs, DATs can raise and deploy capital strategically, positioning them to benefit from narrative-driven investor inflows rather than purely passive exposure.
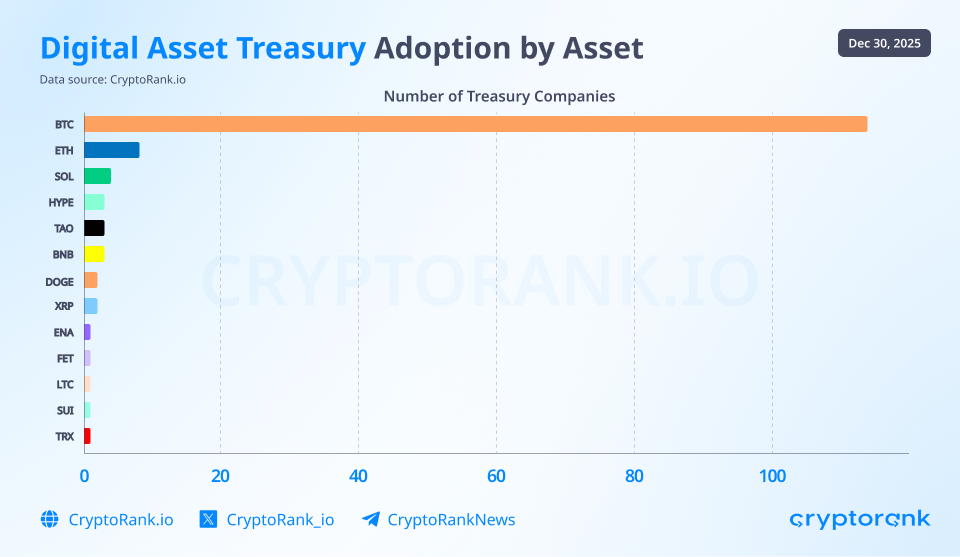
That flexibility, however, introduces fragility: the model is vulnerable to premium collapses, regulatory shifts, and broader capital market disruptions. Firms that rely excessively on PIPE financing or leverage are especially exposed and could face severe drawdowns when market conditions deteriorate.
While DATs are currently reinforcing a positive feedback loop for crypto prices, a sufficiently large expansion of this category could eventually invert that dynamic, turning an unwind of the trade into a systemic headwind. For now, this risk remains largely theoretical, excluding Strategy, DATs are still relatively small, holding just $28 billion, or 0.93% of the $3.0 trillion total crypto market capitalization.
Predictable Yield and Capital Efficiency Drive DeFi Growth
Shifts within the top 10 protocols by TVL over the past four years reveal clear changes in market structure and direction. A four-year timeframe is sufficient to capture meaningful rotation at the top, filtering out short-term noise while highlighting structural trends in protocol dominance.
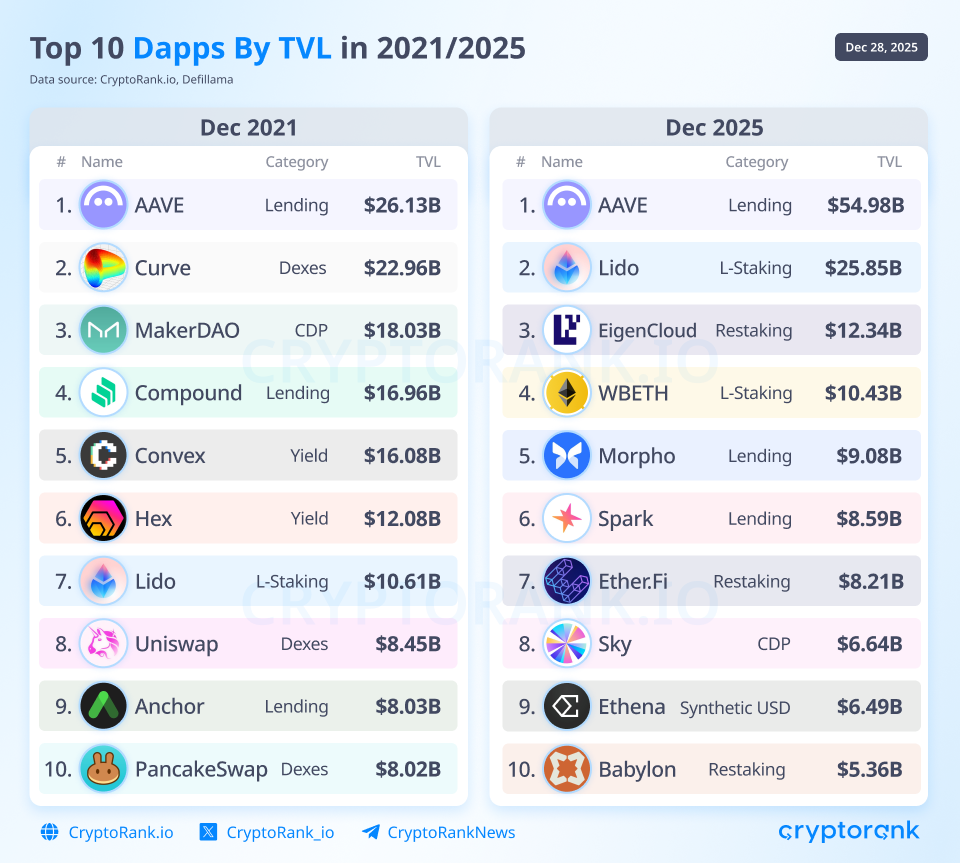
The comparison highlights a structural shift in where DeFi TVL concentrates in core primitives. In 2021, top protocols were diversified across DEXs, CDPs, and yield aggregators. By 2025, TVL is overwhelmingly concentrated in lending, liquid staking, and restaking protocols, signaling a move away from activity-driven primitives toward balance-sheet infrastructure, where capital can remain deployed passively for extended periods.
The dominance of Aave, Lido, and restaking protocols suggests TVL growth is driven less by user demand and more by capital efficiency and yield layering. Lending protocols fit this thesis structurally: overcollateralization, reusable collateral, and leverage loops mechanically inflate TVL.
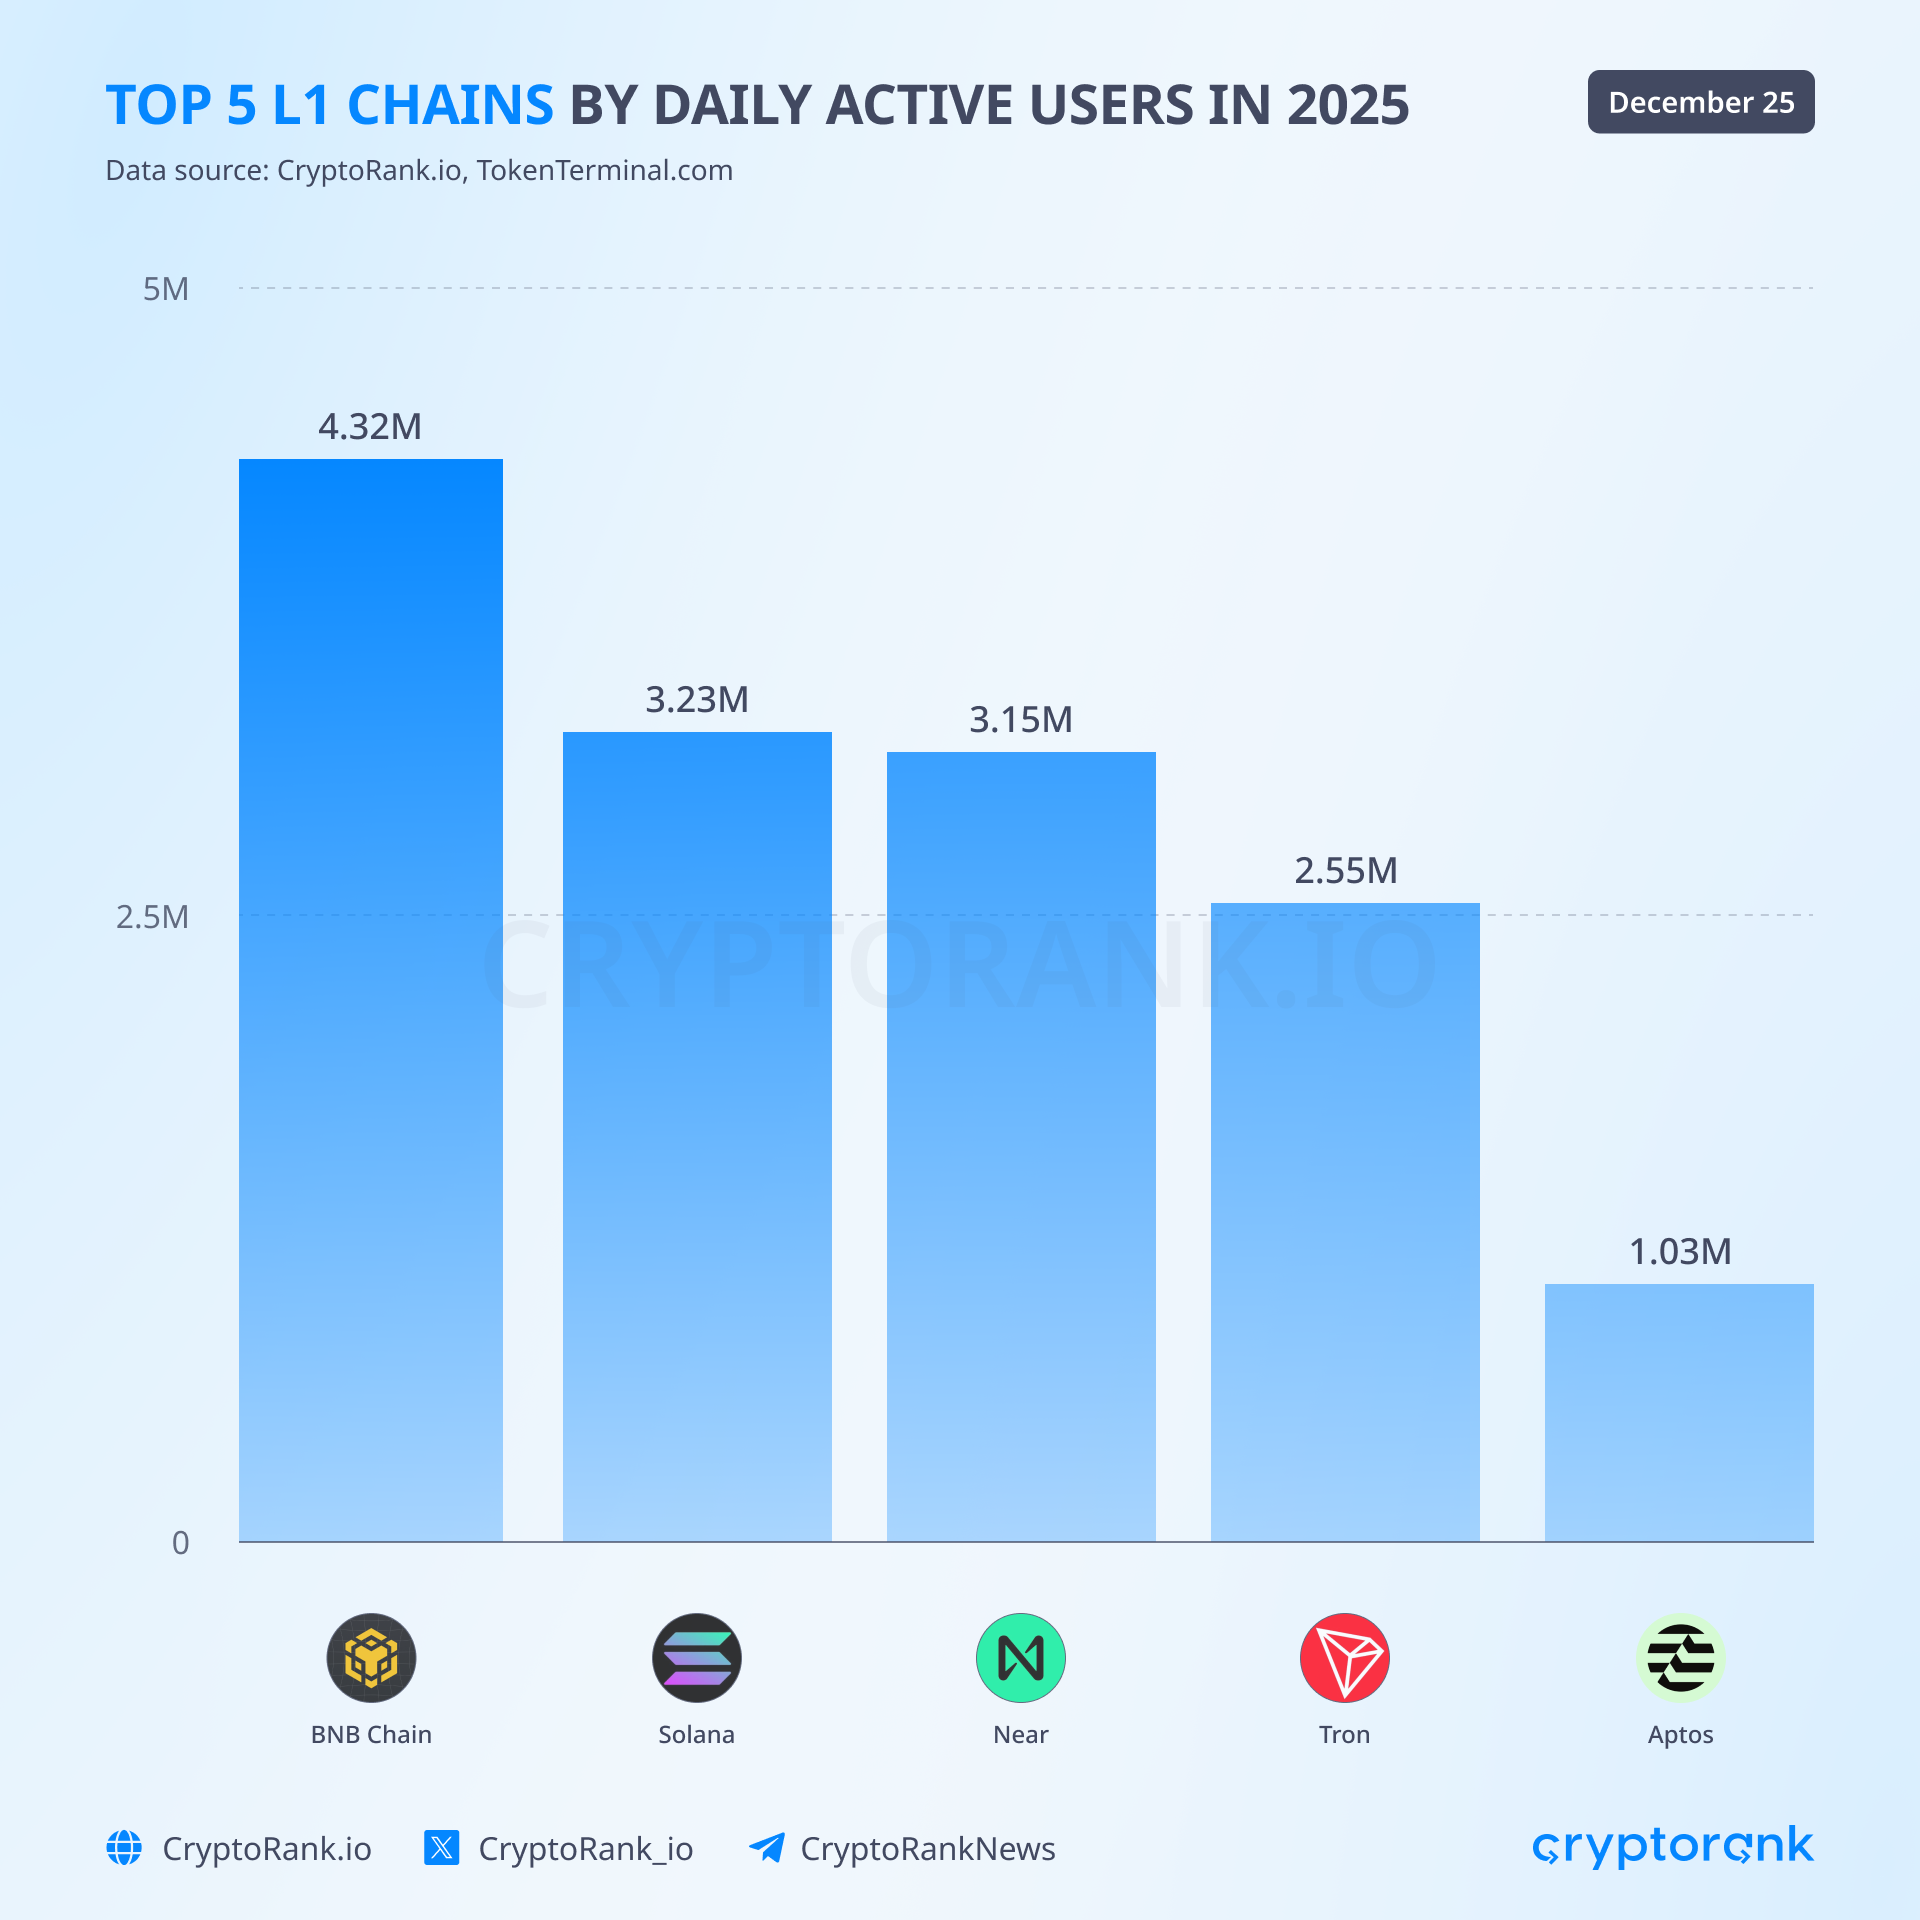
The State of Leading Blockchains: BNB Chain, Solana, Baseк
BNB Chain leads the year in daily active addresses
This year saw a grand return of user activity to the BNB ecosystem, contributing to new ATHs across key metrics. BNB Chain led the year in daily active addresses , even outpacing Solana. Stablecoin market cap reached a $14B ATH in mid-October, while TVL climbed to its highest level since April 2022, at $16B. By DEX volume, BNB Chain ranked third, just behind Solana and Ethereum, with volumes increasing steadily throughout the year and peaking at $119B in October.
The Binance Alpha flywheel became one of the most important drivers of the chain’s growth. Binance Alpha is a platform featuring early-stage tokens that may be listed on Binance in the future. On-chain activity on BNB Chain provides additional rewards for users within this program, incentivizing interaction with the network’s protocols.
This approach allowed Binance to successfully direct traffic to BNB Chain. On some days, the network recorded over one million new addresses, alongside solid growth in DEX volume and transaction count. It is likely Binance will continue to rely on this strategy in 2026, as no competing blockchain has been able to replicate the same growth strategy.
The launch of Aster, a BNB-native perpetual DEX endorsed by CZ, was another key event for the ecosystem. The platform quickly attracted traders and liquidity, reporting daily trading volumes in the tens of billions of dollars at its peak. At the same time, the ASTER token rose roughly 10x in the first week, further fueling the hype. Aster managed to sustain its momentum, ranking third by perpetual trading volume in November.
BNB token price rose strongly in autumn, driven by institutional inflows and increased network activity. On October 13, BNB set a new ATH of $1369. At the same time, volatility stayed high, and several market pullbacks erased part of the gains, leaving performance mixed by year-end.
On the development side, BNB Chain delivered major performance upgrades through the Lorentz and Maxwell hard forks. These upgrades reduced block times to 0.75 seconds, lowered median gas fees to 0.05 gwei (below $0.01), and cut malicious MEV by 95%. The Fermi upgrade, scheduled for January 14, is expected to reduce block finality to 0.45 seconds, with longer-term goals including sub-150ms finality, 20K+ TPS, and on-chain compute hubs.
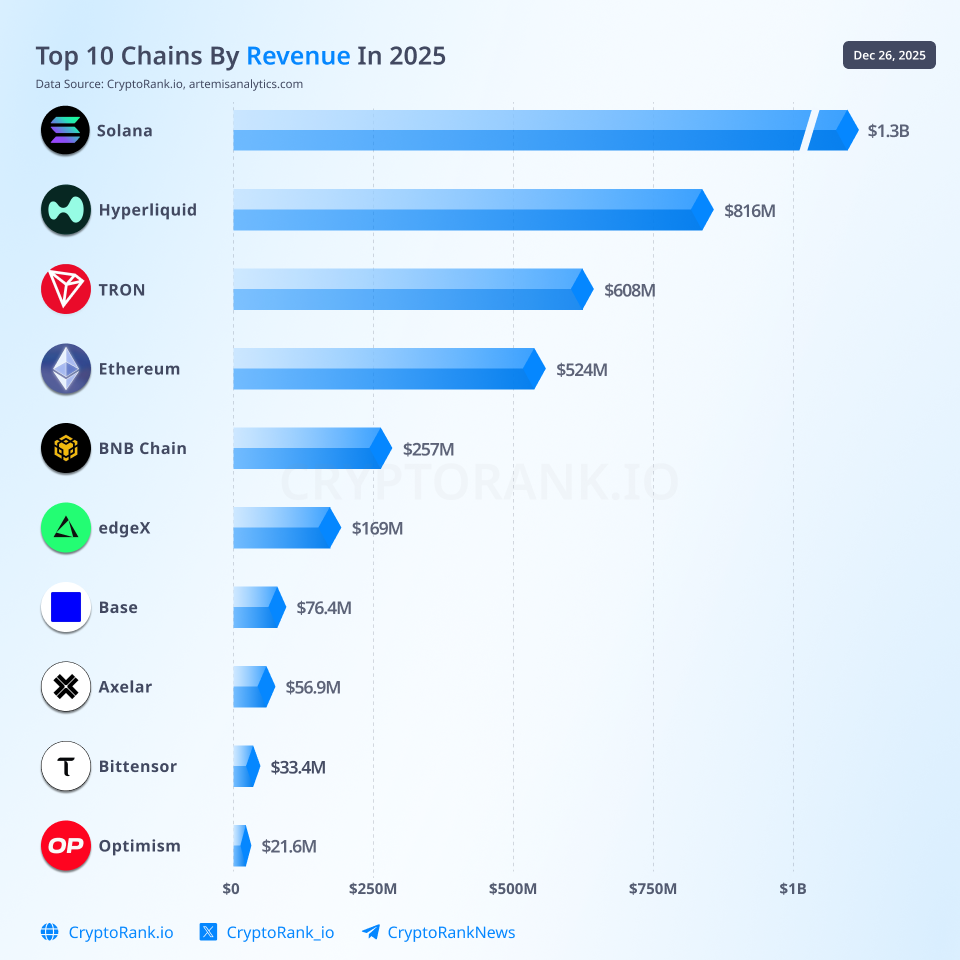
Solana is the top chain by revenue in 2025
It’s been a year of ups and downs for Solana. It started with record activity across key metrics: $241M in monthly fees and $313B in DEX volume were reached in January, while transaction count and active addresses were also near ATHs.
Early in the year, Solana continued to benefit from the memecoin season that began in autumn 2024. However, after a series of controversial token launches, activity began to fade. Tokens such as TRUMP, MELANIA, and others absorbed large amounts of liquidity and left most traders at a loss. With degens running out of capital and confidence in quick gains weakened, the memecoin sector entered a “down-only” mode. All major activity indicators, including meme-related volume, trader counts, and token launches, fell sharply from their January peaks.
Overall DEX volume, however, rebounded from a March bottom and steadily recovered over the rest of the year. Total volume reached $1.55T, setting a new record for Solana and securing its top 1 ranking among all chains. In 2025, Solana also recorded $1.3B in revenue, becoming the leading chain by this metric.
In 2025, prop AMMs on Solana saw strong growth as they became a core venue for high-frequency and directional trading. Prop AMMs, or proprietary automated market makers, differ from traditional AMMs in that liquidity is provided and actively managed by the protocol itself rather than by external LPs. Low fees and fast finality made Solana well-suited to this model, allowing protocols to handle large volumes without significant slippage or latency. Notable players include Humidify, Tessera, SolFi, and goonFi. By year-end, prop AMMs captured nearly 45% of all Solana DEX volume and 85% of SOL/stablecoin pairs.
SOL’s price performance in 2025 was a true rollercoaster. On January 19, SOL set a new ATH at $293, completing a years-long recovery from the lows following the FTX collapse. The token then fell to around $100 in April before rebounding to $250 in October. By year-end, SOL was trading near $130.
In late October, the first Solana ETP and ETF products launched, giving institutional investors regulated access to the Solana ecosystem. By December 25, cumulative net inflows into spot SOL ETFs had reached $755M, with Bitwise’s BSOL capturing roughly 80% of the total.
In July, Solana rolled out a major network upgrade that increased block capacity by 20%, raising it to 60 million compute units per block. The upgrade improved throughput and expanded scalability. Another major update, Alpenglow, is expected next and aims to reduce transaction finality from around 13 seconds to approximately 0.1–0.15 seconds.
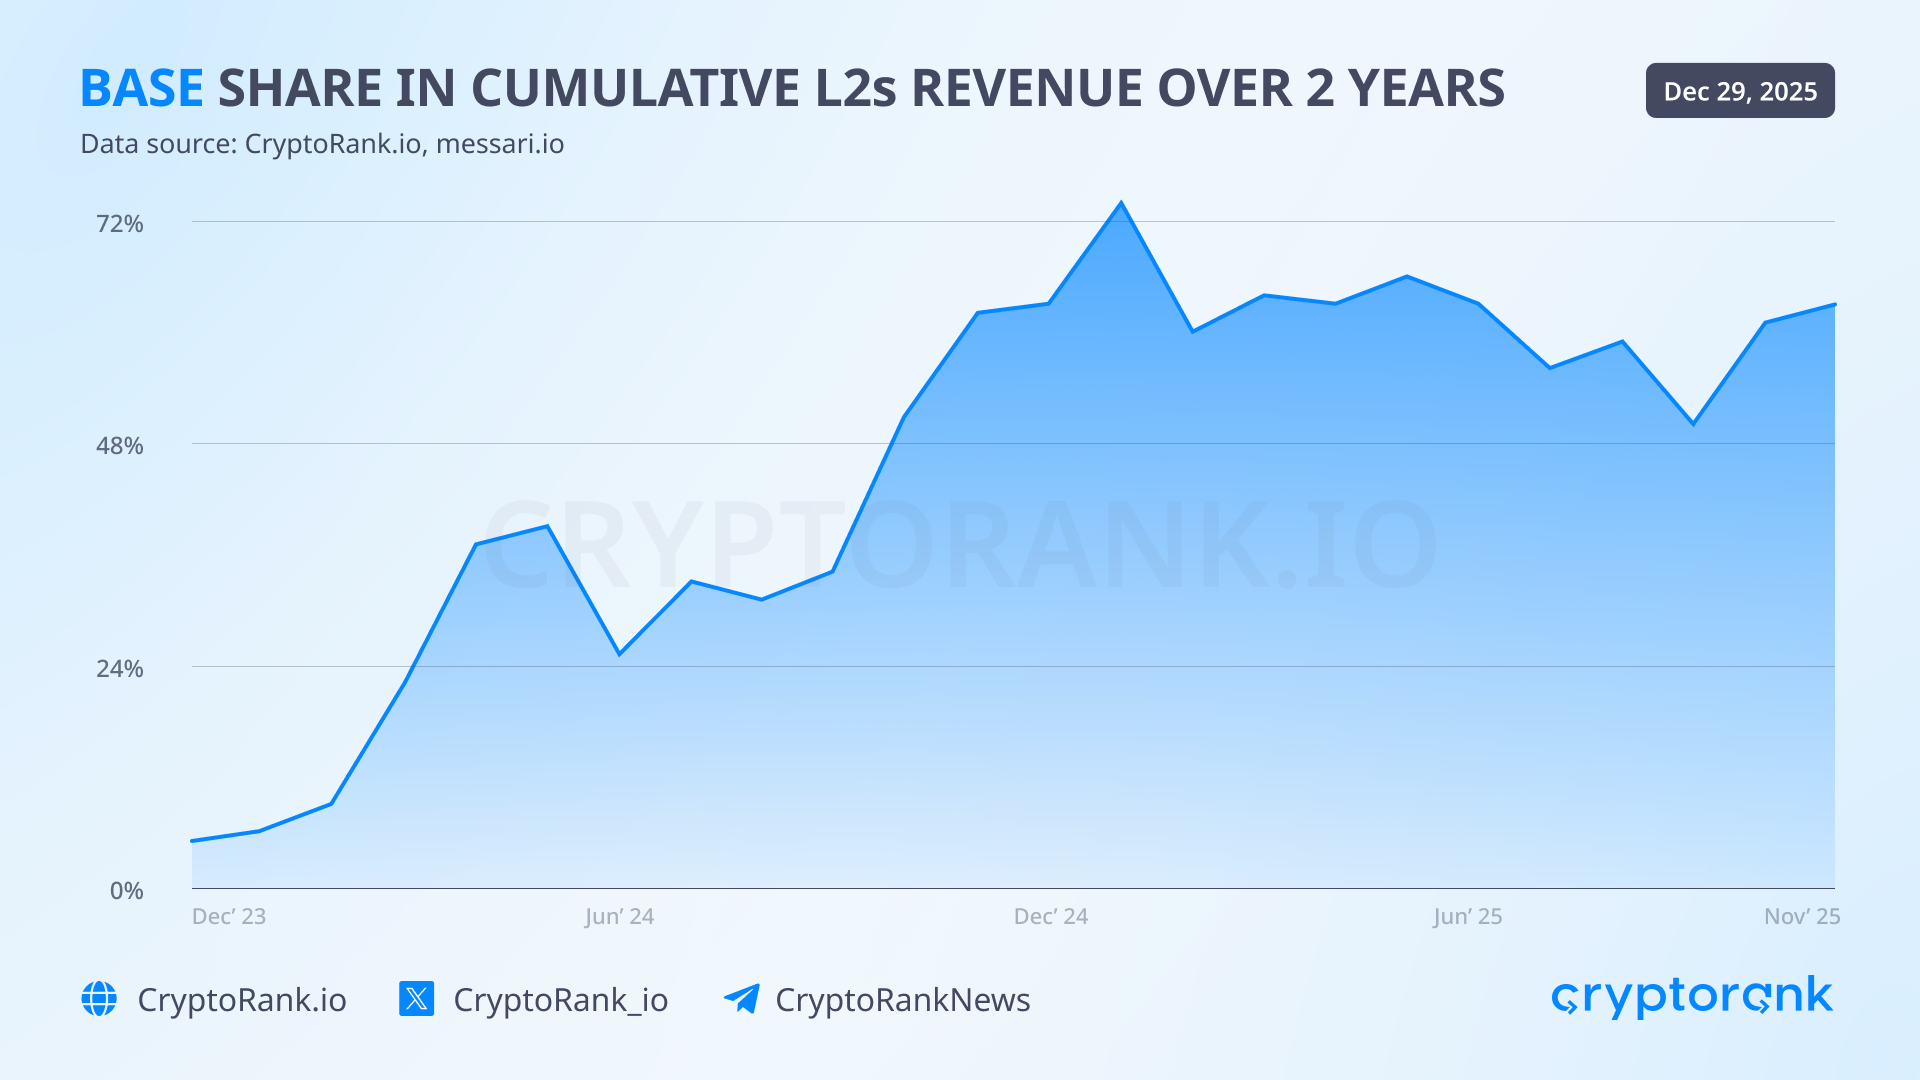
Base accounts for 63% of the total L2 revenue as of December 2025
Base chain showed strong performance this year, strengthening its positions across key verticals, including DeFi and payments. For the first time ever, the chain hit multiple important milestones: $400M in monthly transactions, $53B in monthly DEX volume, and $10B in TVL. Moreover, the current TVL ranks Base 5th among all chains and 1st among L2s. Base also dominated other L2s in revenue, leading each month of 2025 by this metric. By November, Base’s share in cumulative L2 revenue hit 69% – $6.7M of $3M.
Just like BNB Chain, Base is fully utilizing the distribution advantage from its parental CEX, Coinbase. This synergy allows to smoothly onboard Coinbase users on-chain with less effort and incentives than other chains must provide to draw user attention. This year, they enabled token trading on Base’s DEXs in the Coinbase App. The integration aims provide traders with access to a wider range of new tokens while providing devs with exposure to a larger audience.
Base App (formerly Coinbase Wallet) has been repurposed as the primary interface for interacting with the Base ecosystem. It is fully on-chain-focused, combining a wallet with native access to dApps, such as Zora, Football.fun, and others. The app went open to the general public a few weeks ago.
This year, Coinbase gave birth to a new narrative, x402. In short, it is a protocol that allows services to charge for access on a per-request basis using stablecoins, directly within standard web requests. Instead of accounts, subscriptions, or external payment flows, a user or a program pays at the moment a request is made.
While x402 is chain-agnostic, Base has been the main environment where it has been tested and adopted so far, with early integrations, tooling, and infrastructure built around it. On Base, x402 is positioned as a payments and infrastructure layer for APIs, agents, and on-chain commerce, rather than a traditional DeFi product. Despite the first-mover advantage, Base is facing strong competition from Solana, which captured a lead by volume in early December.
One of the most discussed topics around Base remains the potential launch of the BASE token. The team confirmed they are currently exploring tokenization, but no official roadmap or timeline has been shared yet. JPMorgan projected that a potential Base token could reach a market capitalization of $34 billion, pointing to a doubling of DeFi TVL over the past year and estimating that an airdrop and token launch could attract up to $23 billion in new liquidity.
Altcoins: Why Altseason Didn’t Come in 2025?
It is safe to say that the altcoin season many expected in 2025 never arrived. While several large-cap tokens managed to set new ATHs (BNB, SOL, HYPE), their momentum was short-lived, with most now down 40–50%. Bitcoin dominance did not fall below 50% this year, with the lowest level recorded on January 2. The Altcoin Season Index (ASI) hovered around 80 for a few weeks in September but has since dropped below 30 and remained there for several months.
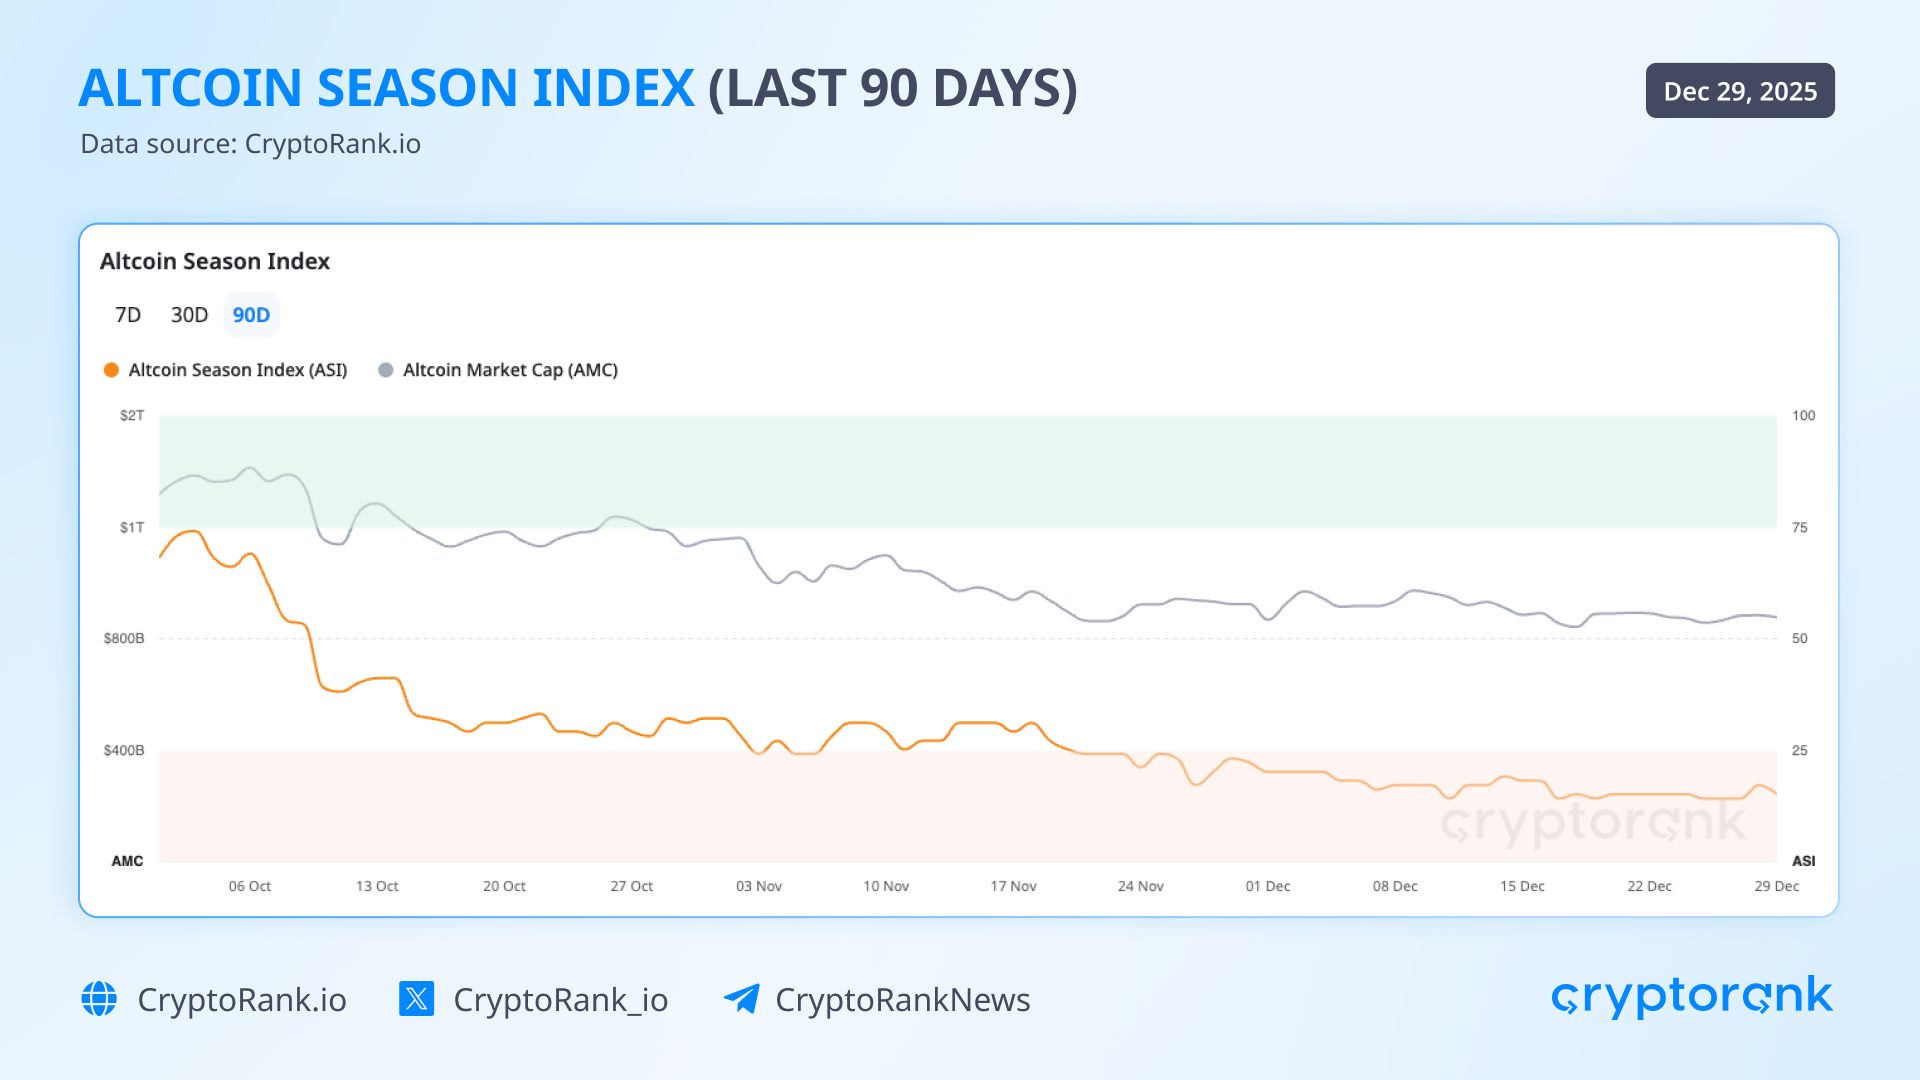
Data obtained by API
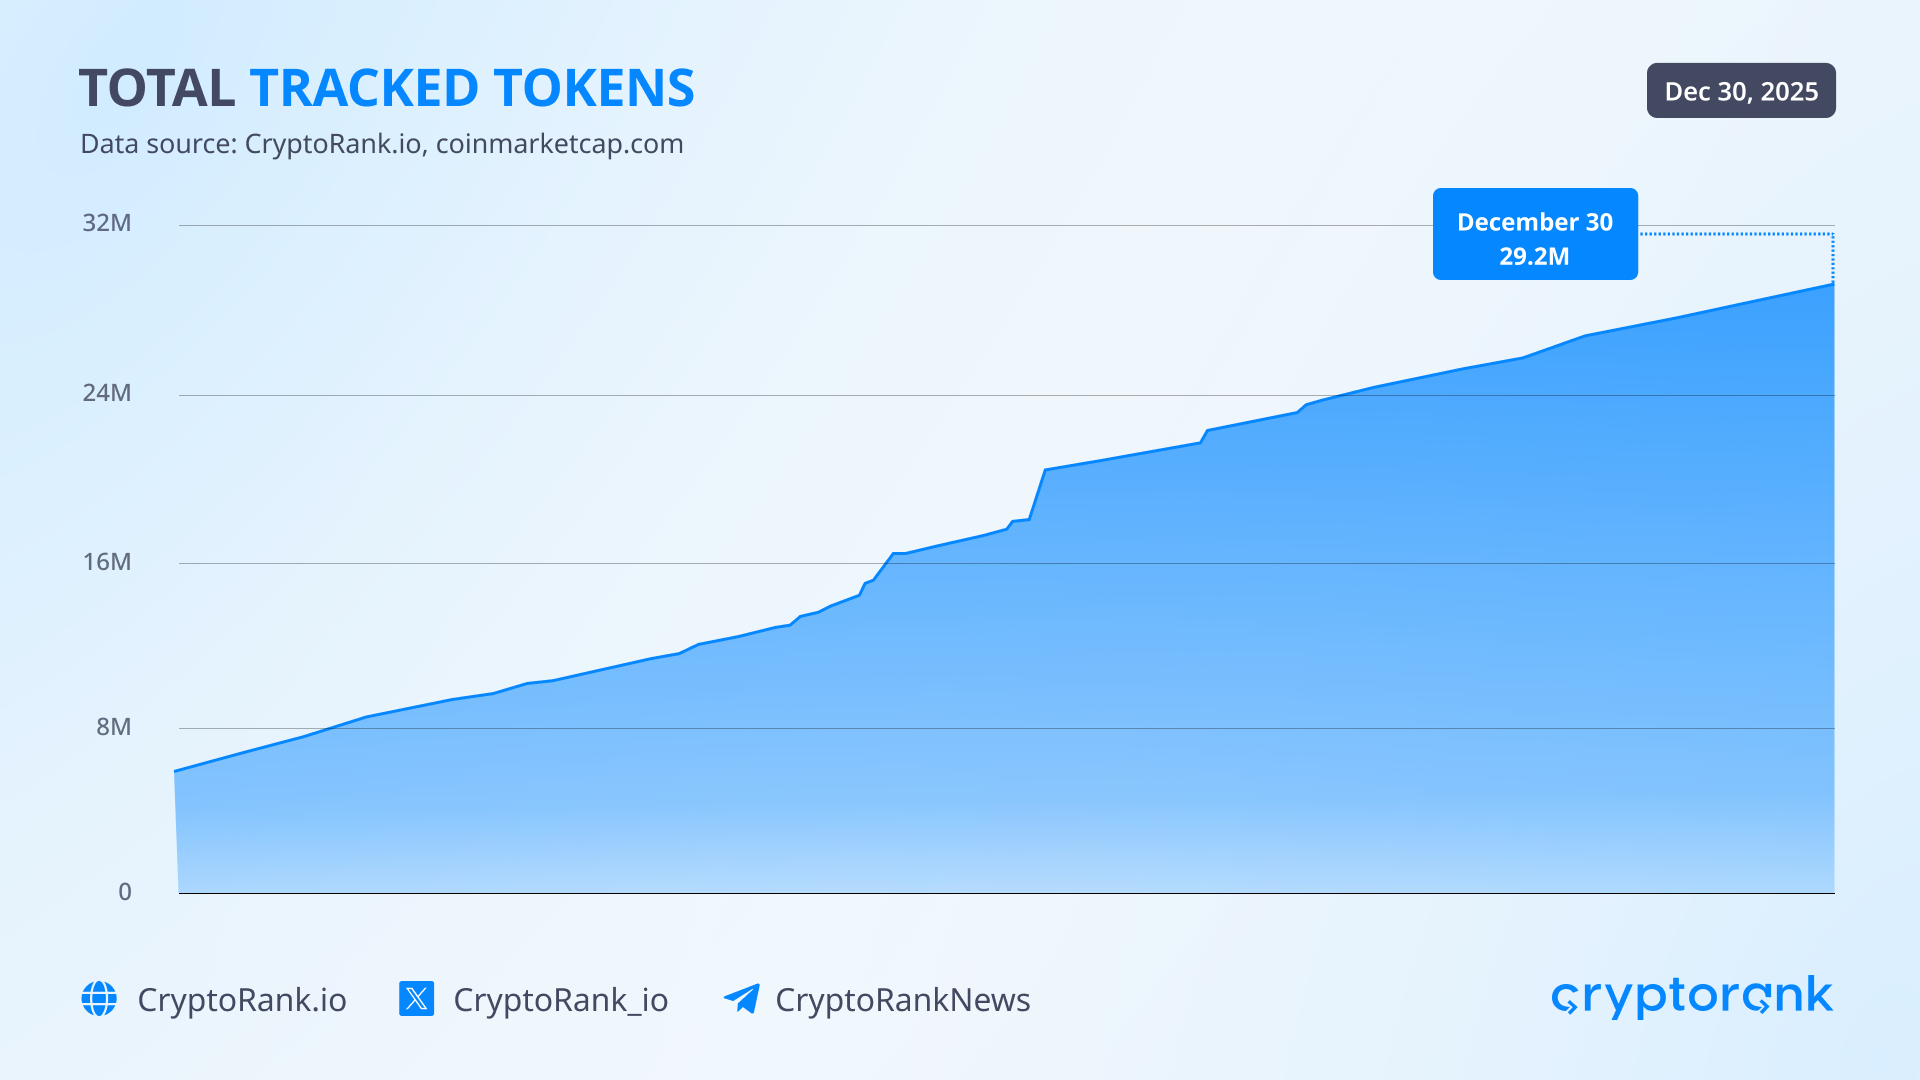
There are several key reasons why an altseason failed to show up. One of them is the fragmentation of capital across narratives. New narratives constantly replace older ones, making previous runners irrelevant. Each year, thousands of new tokens enter the market, diluting attention and liquidity. Thus, a year ago, CMC tracked 5.8M tokens, while today the number stands at 29.2M.
Under these conditions, even newly launched tokens struggle to hold value: according to the research, only 15% of altcoins launched this year are trading above their TGE price.
In 2025, low float, high FDV token launches continued to hold back a broad altcoin season because most of the upside is captured by private and early investors, leaving limited opportunity for public markets. With only a small share of supply circulating at launch, prices are often pushed up on thin liquidity, resulting in inflated valuations that don’t reflect real demand. As token unlocks begin, steady sell pressure absorbs new capital, limiting upside and discouraging rotation into altcoins. CryptoRank tracks VC-related sell pressure in a special dashboard.
Earlier this year, a significant share of retail capital moved out of altcoins, especially VC-backed tokens with high FDVs, and flowed into memecoins instead. For a time, memecoins captured most of the speculative activity, but after repeated collapses and failed launches, that liquidity left the segment as well. Importantly, it did not flow back into altcoins, leaving the market thinner and limiting the conditions for an altcoin season.
Institutional capital, meanwhile, has focused on large, resilient assets that performed relatively well under uncertain conditions. High-cap tokens such as ETH, SOL, and XRP saw solid ETF inflows, signaling institutional demand. The emergence of DATs further expanded access by offering regulated exposure beyond spot ETFs. Together, these instruments reflect a clear preference for lower-risk assets and regulatory clarity over higher-risk opportunities.
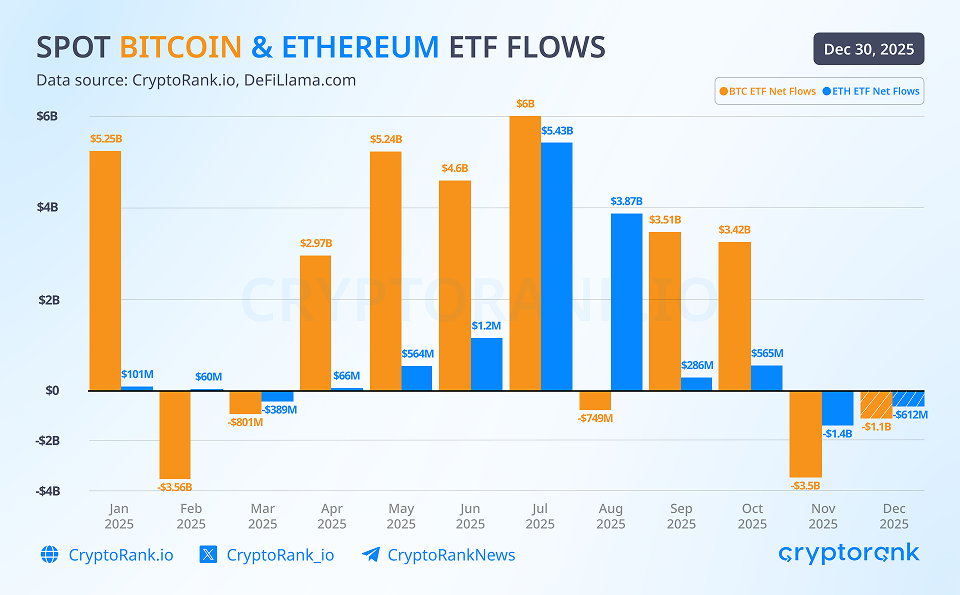
Large ETF inflows fueled the market rally from summer through October. Once significant outflows began, the market quickly reversed. In November, Bitcoin saw $3.5B in net outflows, followed by another $1.1B in December. At this point, it is clear that a broader market recovery is difficult to achieve without renewed institutional inflows.
By contrast, the retail market seems to be shifting toward high-risk, high-reward behavior. While meme trading has slowed, other high-risk sectors have gained traction. Perps and predictions are the most notable, offering traders faster rewards considering the market favours them. Since investing in altcoins is largely a mid- to long-term bet, many participants prefer to chase quicker gains. A few years ago, alts were one of the few ways to build capital quickly. Now, as the market has evolved, altcoins are forced to compete with other instruments for user liquidity.
A few token categories still managed to perform well despite the market turbulence, notably privacy and CEX tokens. According to our data, three privacy tokens ranked among the top 10 gainers this year: ZEC (+861%), XMR (+123%), and DASH (+12%). This performance reflects a broader shift in how privacy is valued, with institutions favoring compliance-friendly, auditable privacy tools, while retail users continue to prefer assets focused on anonymity and censorship resistance.
RWA expansion: Treasuries, Private Credit, Tokenized Stocks, and More
The RWA sector was one of the strongest performers this year. Total on-chain RWA value more than tripled, rising from $5.6B to $18.7B. At the same time, the number of RWA holders reached 550K. The US Treasuries remain the leading force in the sector, accounting for $8.5B, which is nearly 50% of the total RWA market. In short, these products turn T-bills and government money market exposure into tokens that can move alongside stablecoins and be used as collateral across both DeFi and centralized platforms.
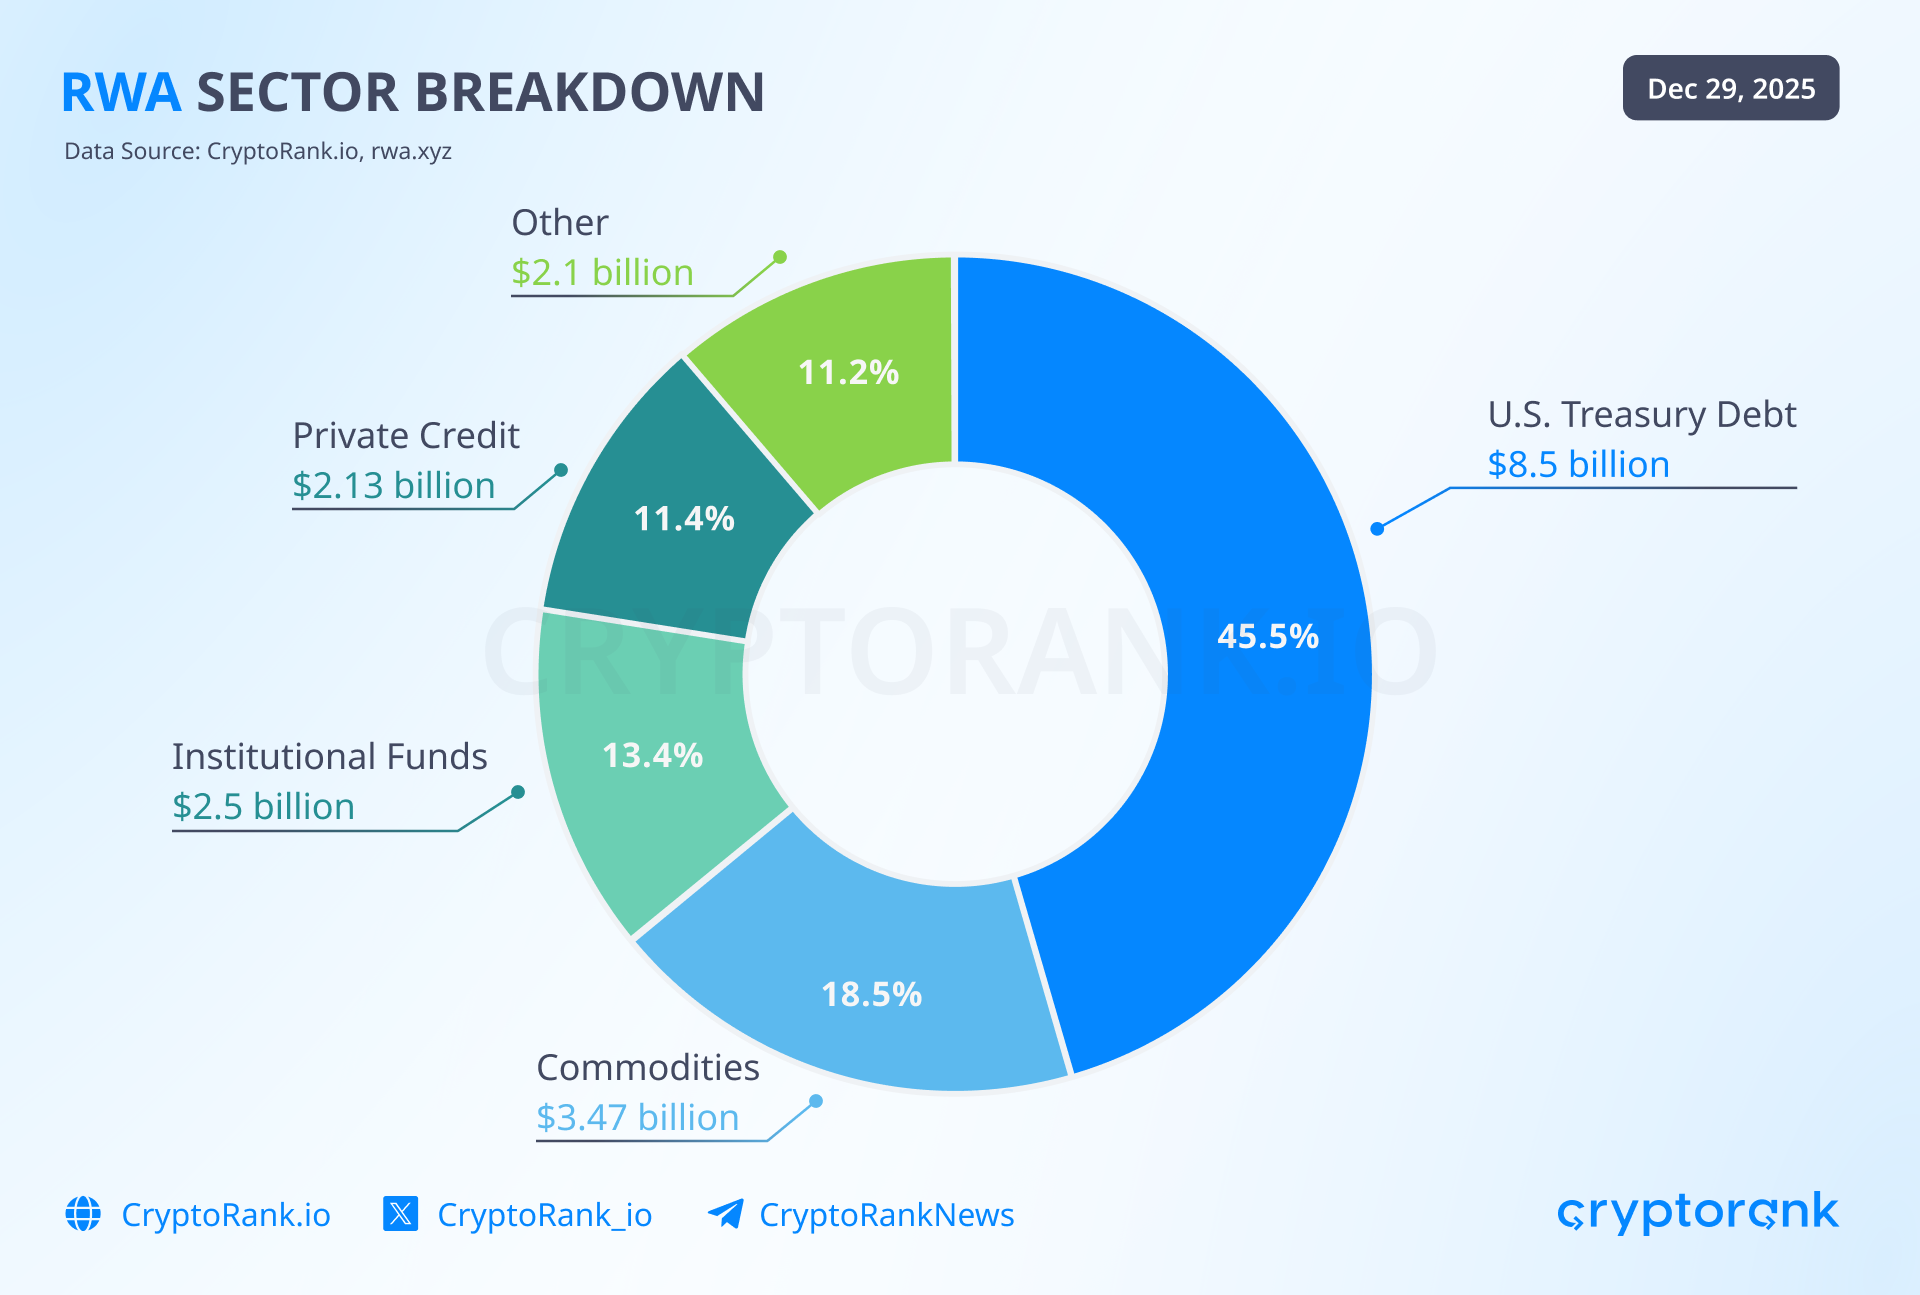
However, other asset classes continued to grow and mature as well. In 2025, commodities increased from $1B to $3.47B in value, while institutional funds expanded from $185M to $2.5B. The most significant growth in on-chain value came from private credit, which jumped from $6M to $2.13B. This data shows that tokenization has taken off first in areas where blockchain provides clear benefits, particularly fixed income and private credit. These assets fit well on-chain, as they can be used for yield, collateral, and treasury purposes without introducing significant volatility.
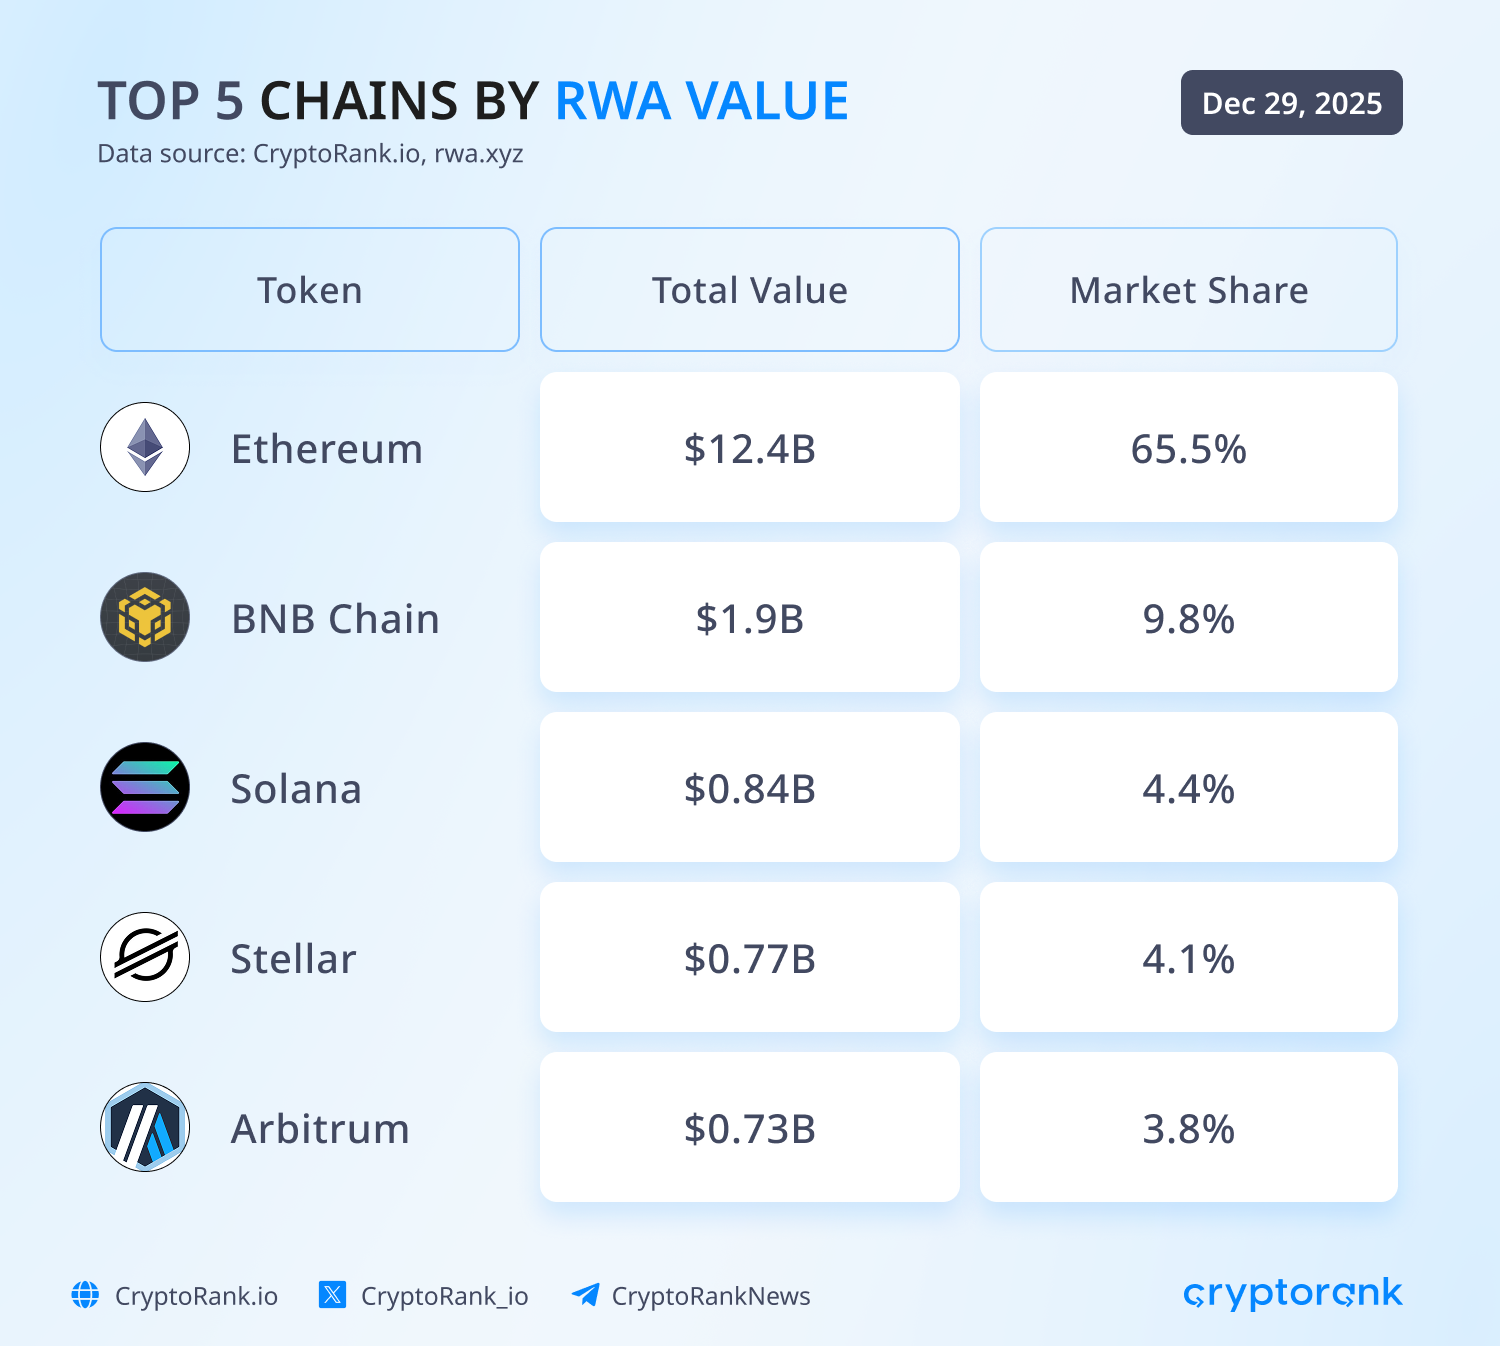
Ethereum remains the largest RWA home, holding $12.3B in asset value. It is followed by BNB Chain, Solana, Arbitrum, and Stellar. It is worth noting that these figures include only so-called distributed assets, those that can be transferred between wallets.
Various RWA-related products also showed outstanding performance in 2025:
-
xStocks brought more than 60 fully collateralized U.S. equities, including AAPL, NVDA, and TSLA, on-chain as SPL tokens on Solana, each backed 1:1 by real shares held in custody.
-
Ondo Finance’s flagship products saw strong growth this year. OUSG, a tokenized short-term U.S. Treasury fund backed by institutional money market funds (including positions from BlackRock’s BUIDL), and USDY, a yield-bearing token backed by short-term U.S. Treasuries and bank deposits, attracted significant capital. OUSG currently holds $829M in on-chain value.
-
Maple Finance demonstrated solid growth across key metrics. The protocol now manages $4.3B in assets under management (AUM): syrupUSDC accounts for $3.1B, while syrupUSDT holds $0.94B. Maple’s monthly revenue increased from $0.41M to $2M.
-
Centrifuge surpassed $1.3B in RWA TVL, led by its two main products: the Janus Henderson Anemoy AAA CLO Fund ($1B) and the Janus Henderson Anemoy Treasury Fund ($263M).
The Canton Network report identifies market fragmentation as one of the key challenges facing RWAs. Assets are spread across multiple blockchains, each with different standards, liquidity environments, and protocols, leading to inefficiencies in pricing, capital allocation, and liquidity formation.
Addressing this fragmentation depends on interoperability that enables assets, data, and settlement to move smoothly across networks. This fragmentation also helps explain why stablecoins have become the most scalable on-chain RWA: they already operate across chains with deep liquidity and consistent standards, effectively serving as the settlement layer for other tokenized assets.
Stablecoins Set Multiple Records as Legislation Accelerates Adoption
In 2025, the stablecoin sector cemented itself as the cornerstone of the crypto industry. Regulatory clarity was the main theme, and the creation of formal regulatory frameworks allowed the sector to take a major step toward institutional adoption.
The most important development was the GENIUS Act, a US legislative proposal aimed at creating a clear federal regulatory framework for stablecoins. It sets rules for issuance, reserve backing, and oversight, allowing stablecoin issuers to operate legally in the US while improving consumer protection and regulatory clarity. Meanwhile, the EU’s Markets in Crypto-Assets Regulation (MiCA) introduced a unified framework for stablecoins and crypto assets across all member states.
In 2025, stablecoins became increasingly visible in mainstream payment flows as large fintech and commerce platforms began supporting them directly. Stripe expanded stablecoin settlement for merchants, Shopify rolled out stablecoin-based checkout options for selected merchants, while PayPal continued integrating PYUSD into peer-to-peer transfers and merchant payments.
Regulatory clarity and institutional adoption were reflected in a notable increase in stablecoin-related on-chain metrics. Total stablecoin market capitalization grew by 50% this year, rising from $205B to $308B. This increase was led by USDT, which supply increased from 137B to 187B, while the USDC supply grew from 44B to 76B.
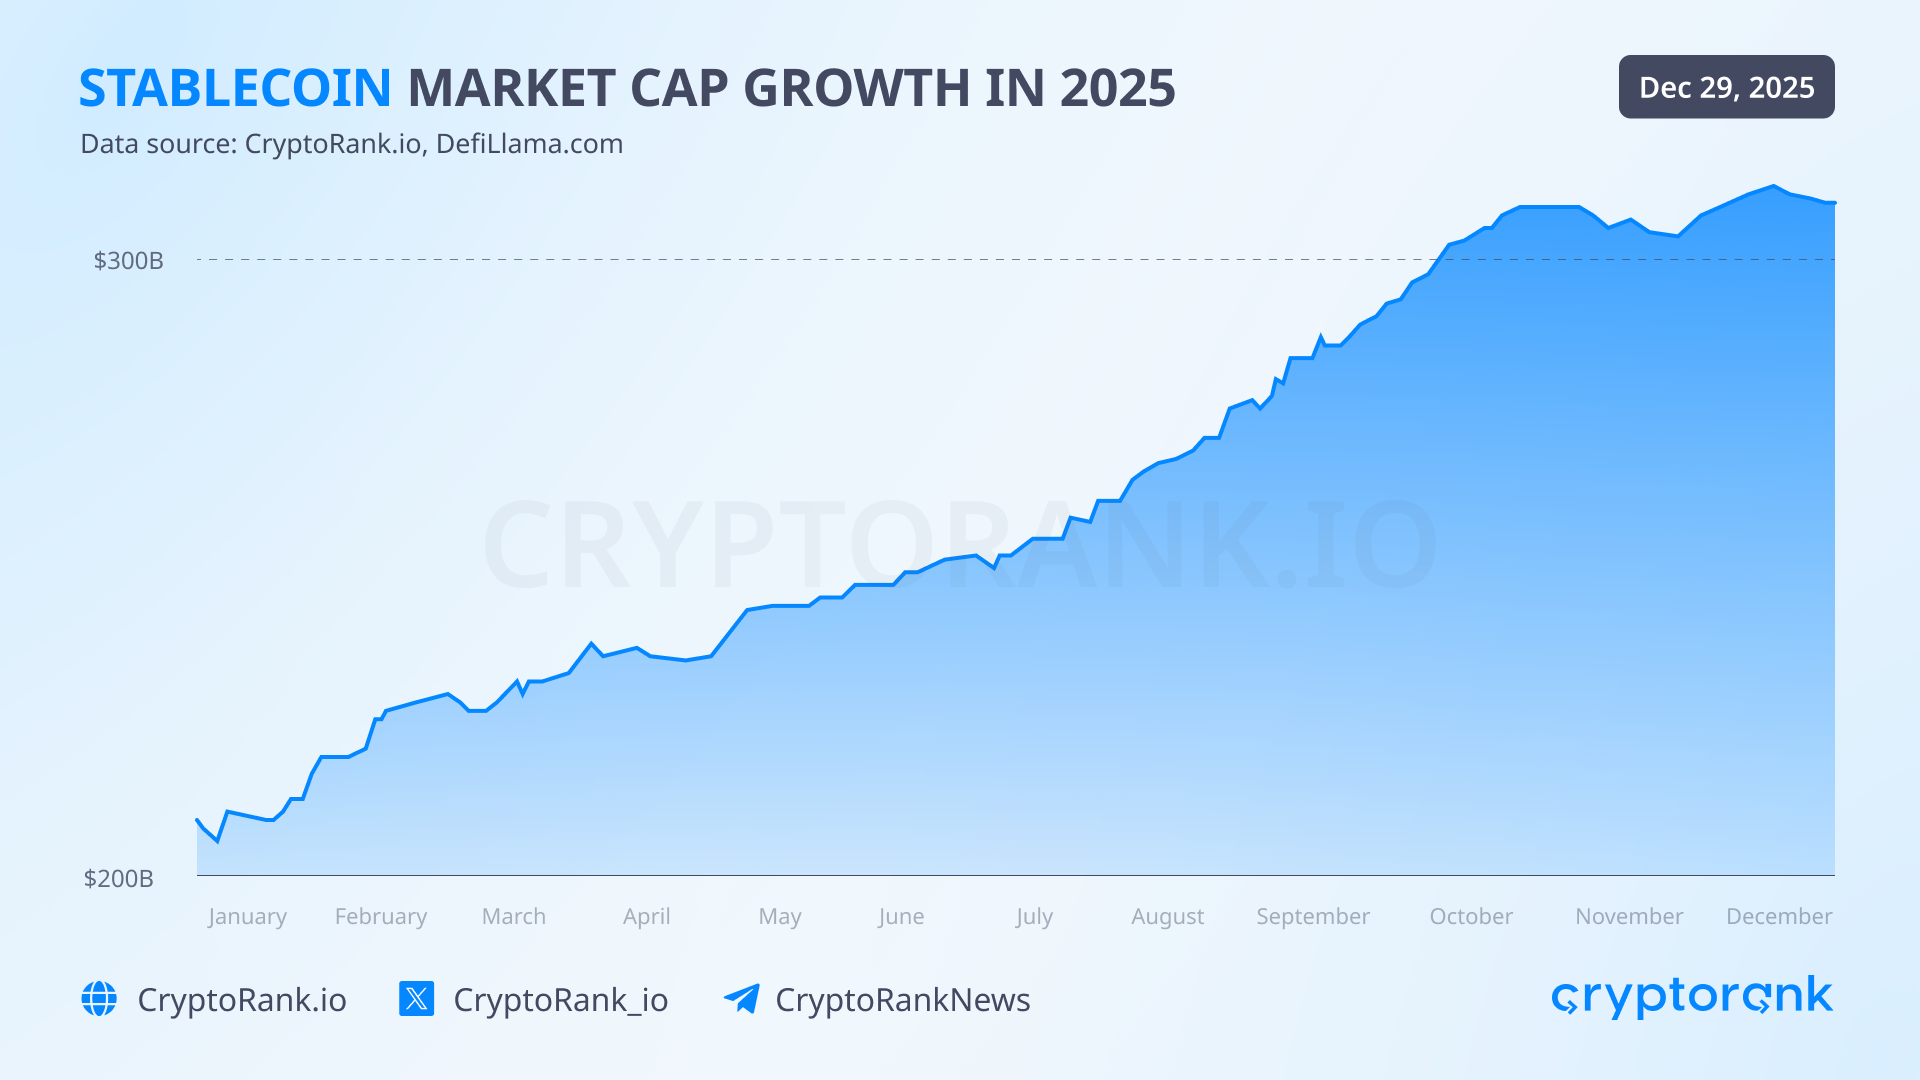
Data source: CryptoRank API
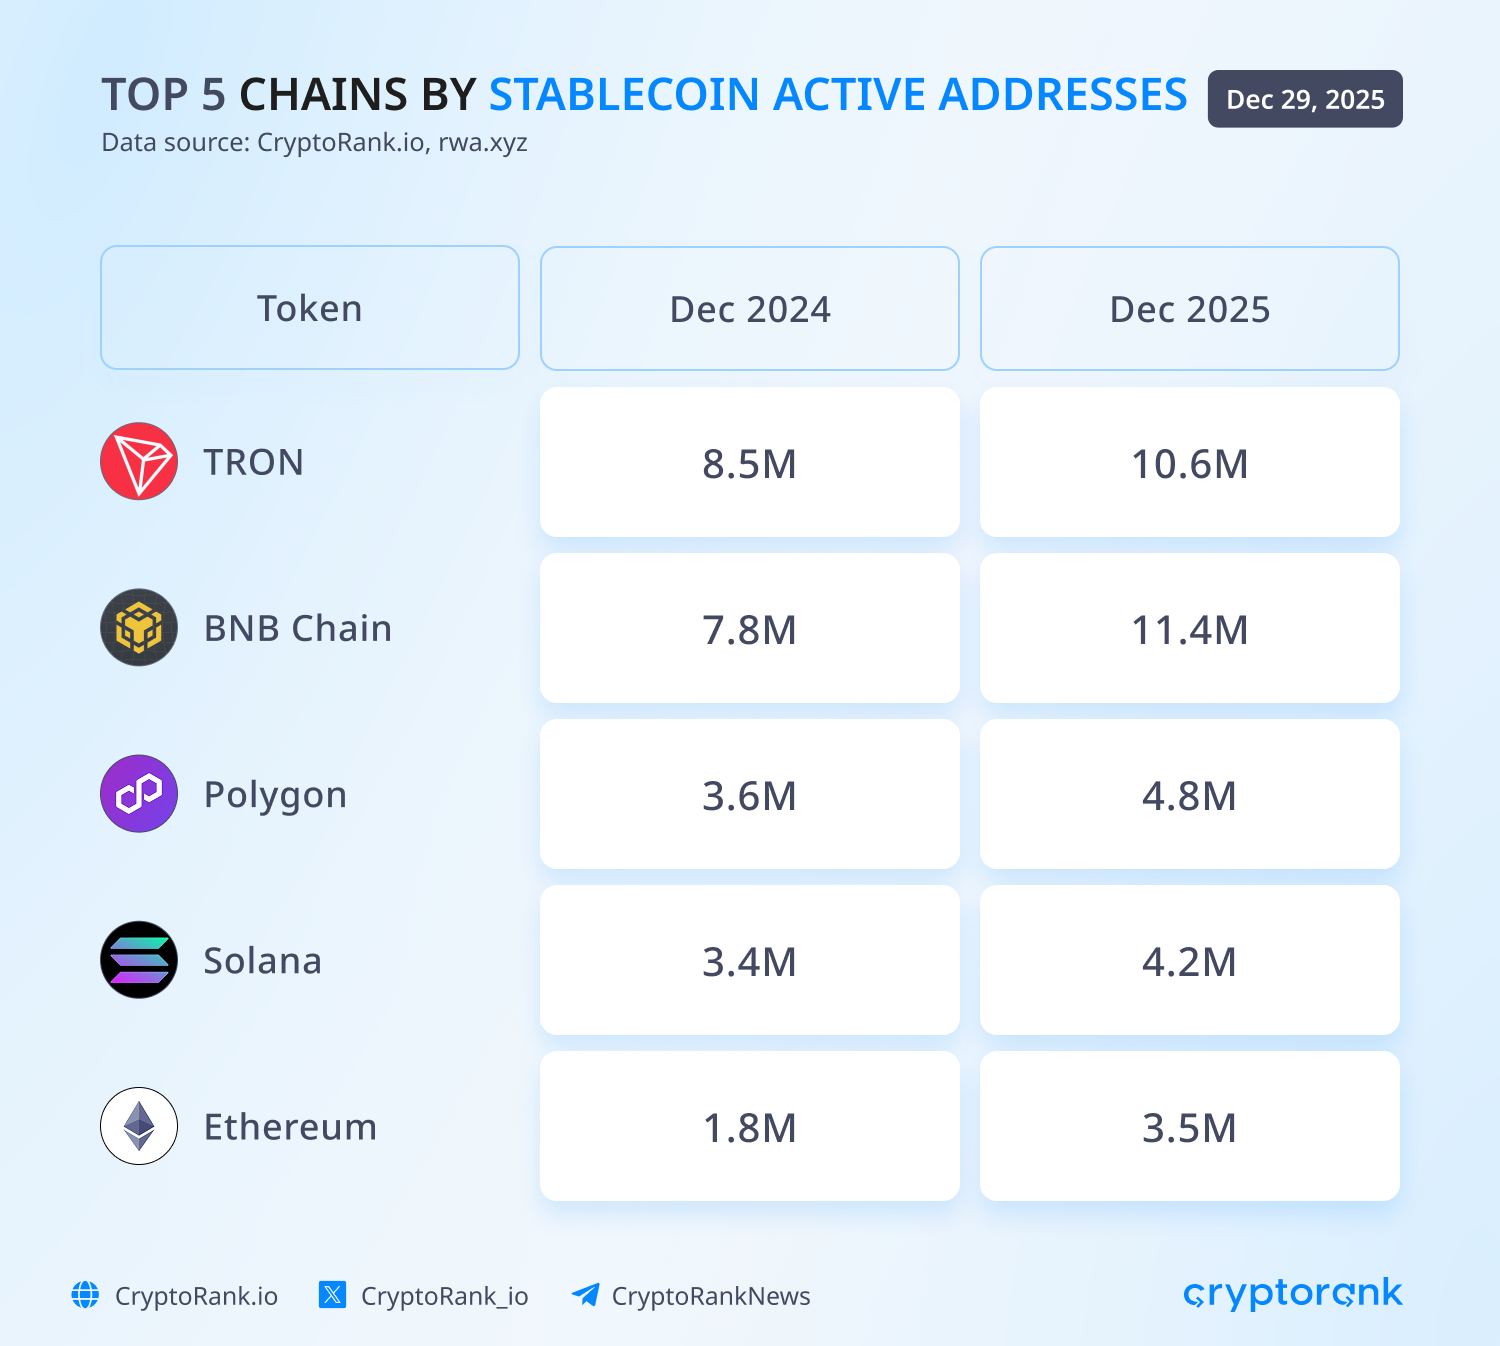
In November, stablecoin active addresses reached 44.3 million. Once again, USDT and USDC were far ahead of other players with 29M and 13.6M active users, respectively. No other stablecoin issuer managed to reach the 1M mark. Looking at active addresses by chain, 2025 saw a new king of the hill. After years of dominance, TRON was dethroned by BNB Chain, which experienced a broad increase in user activity that also supported stablecoin growth.
The list of the top five chains by stablecoin supply remained unchanged from January 2025. Ethereum hosts 56% of the total stablecoin supply, with circulating supply growing from $115.6B to $171.4B. TRON’s stablecoin supply increased from $57.9B to $80.6B, while Solana’s more than tripled in 2025, reaching $16.3B.
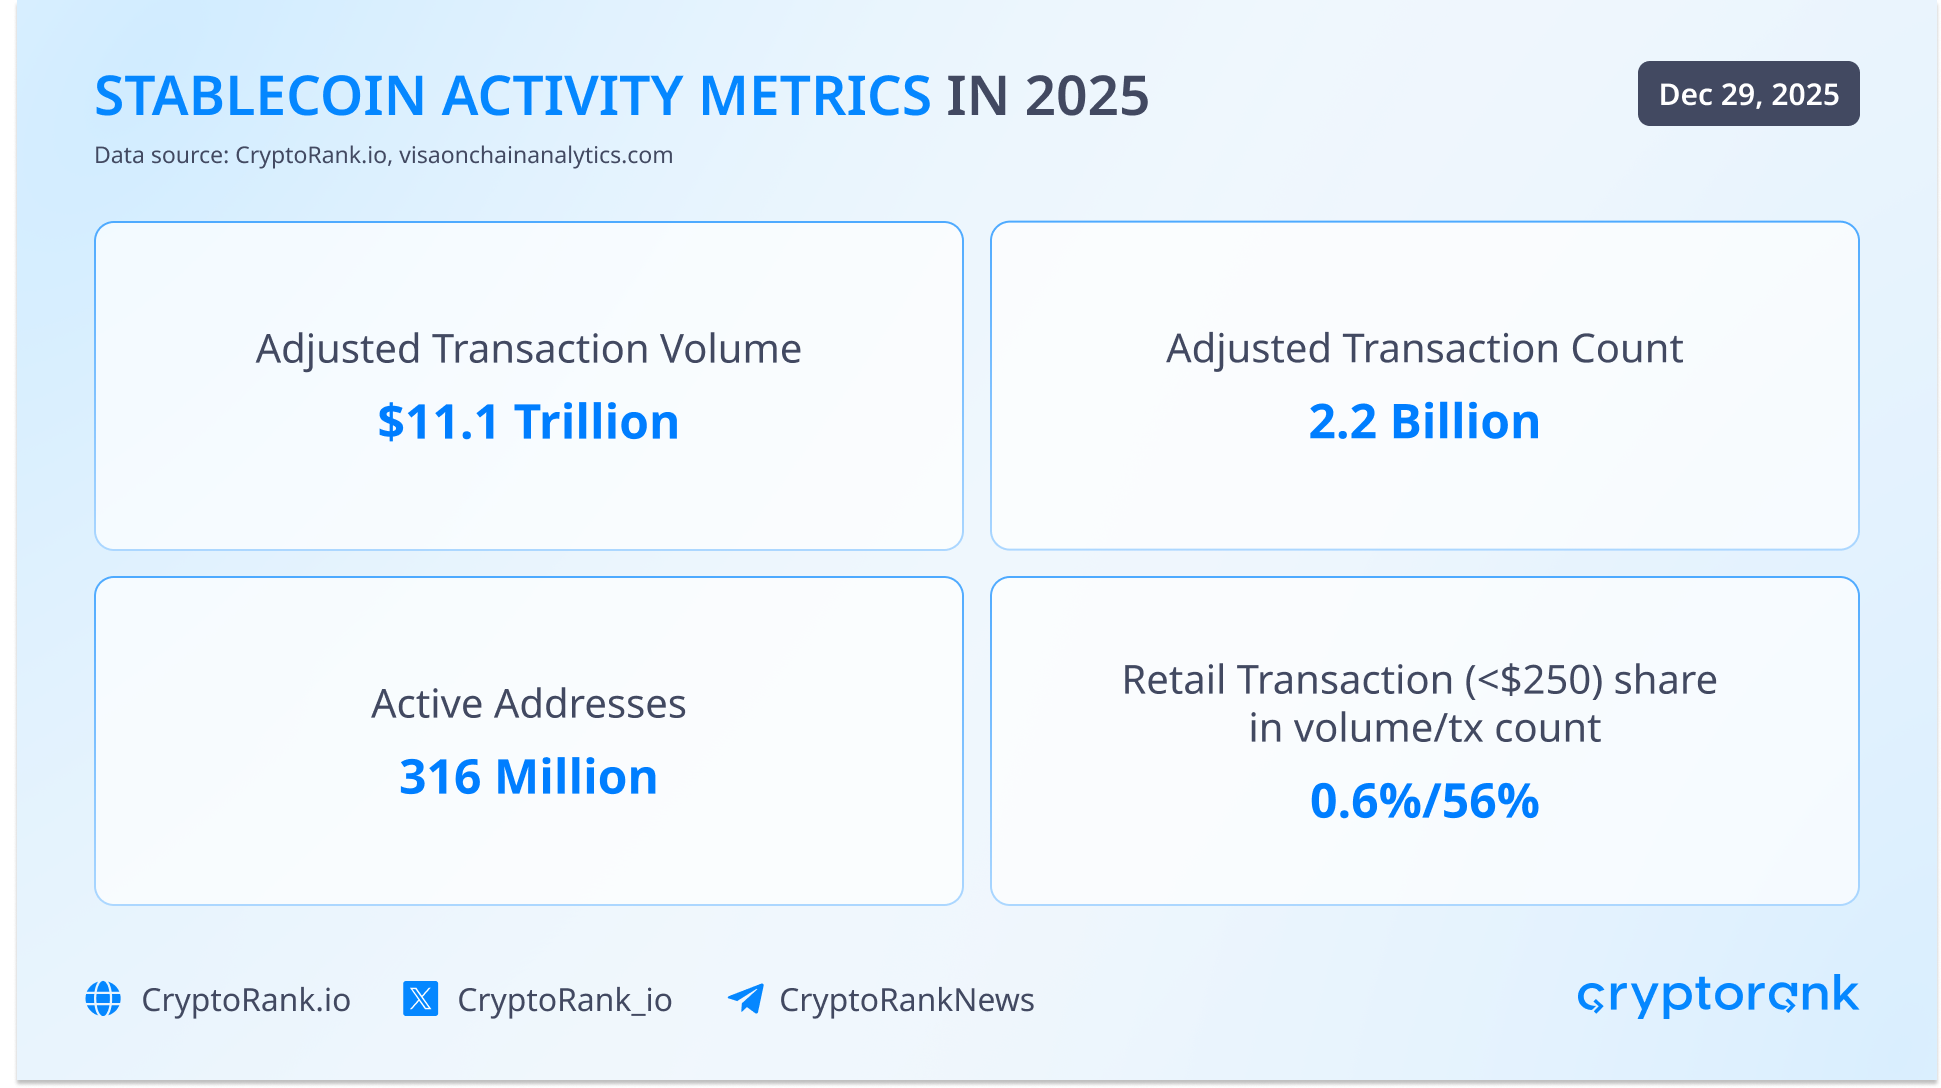
In 2025, there was a significant increase in stablecoin-related transaction count and volume. According to Visa, adjusted transaction count was 2.2 billion, while adjusted transaction volume was $11.1 trillion. Interestingly, retail-sized transactions (< $250) account for only 0.6% of total adjusted volume, but at the same time represented 56% of adjusted transaction count. Over the last 12 months, there were 246M unique stablecoin sending addresses and 306M receiving addresses.
Prediction Markets Shining: Polymarket vs Kalshi Battle
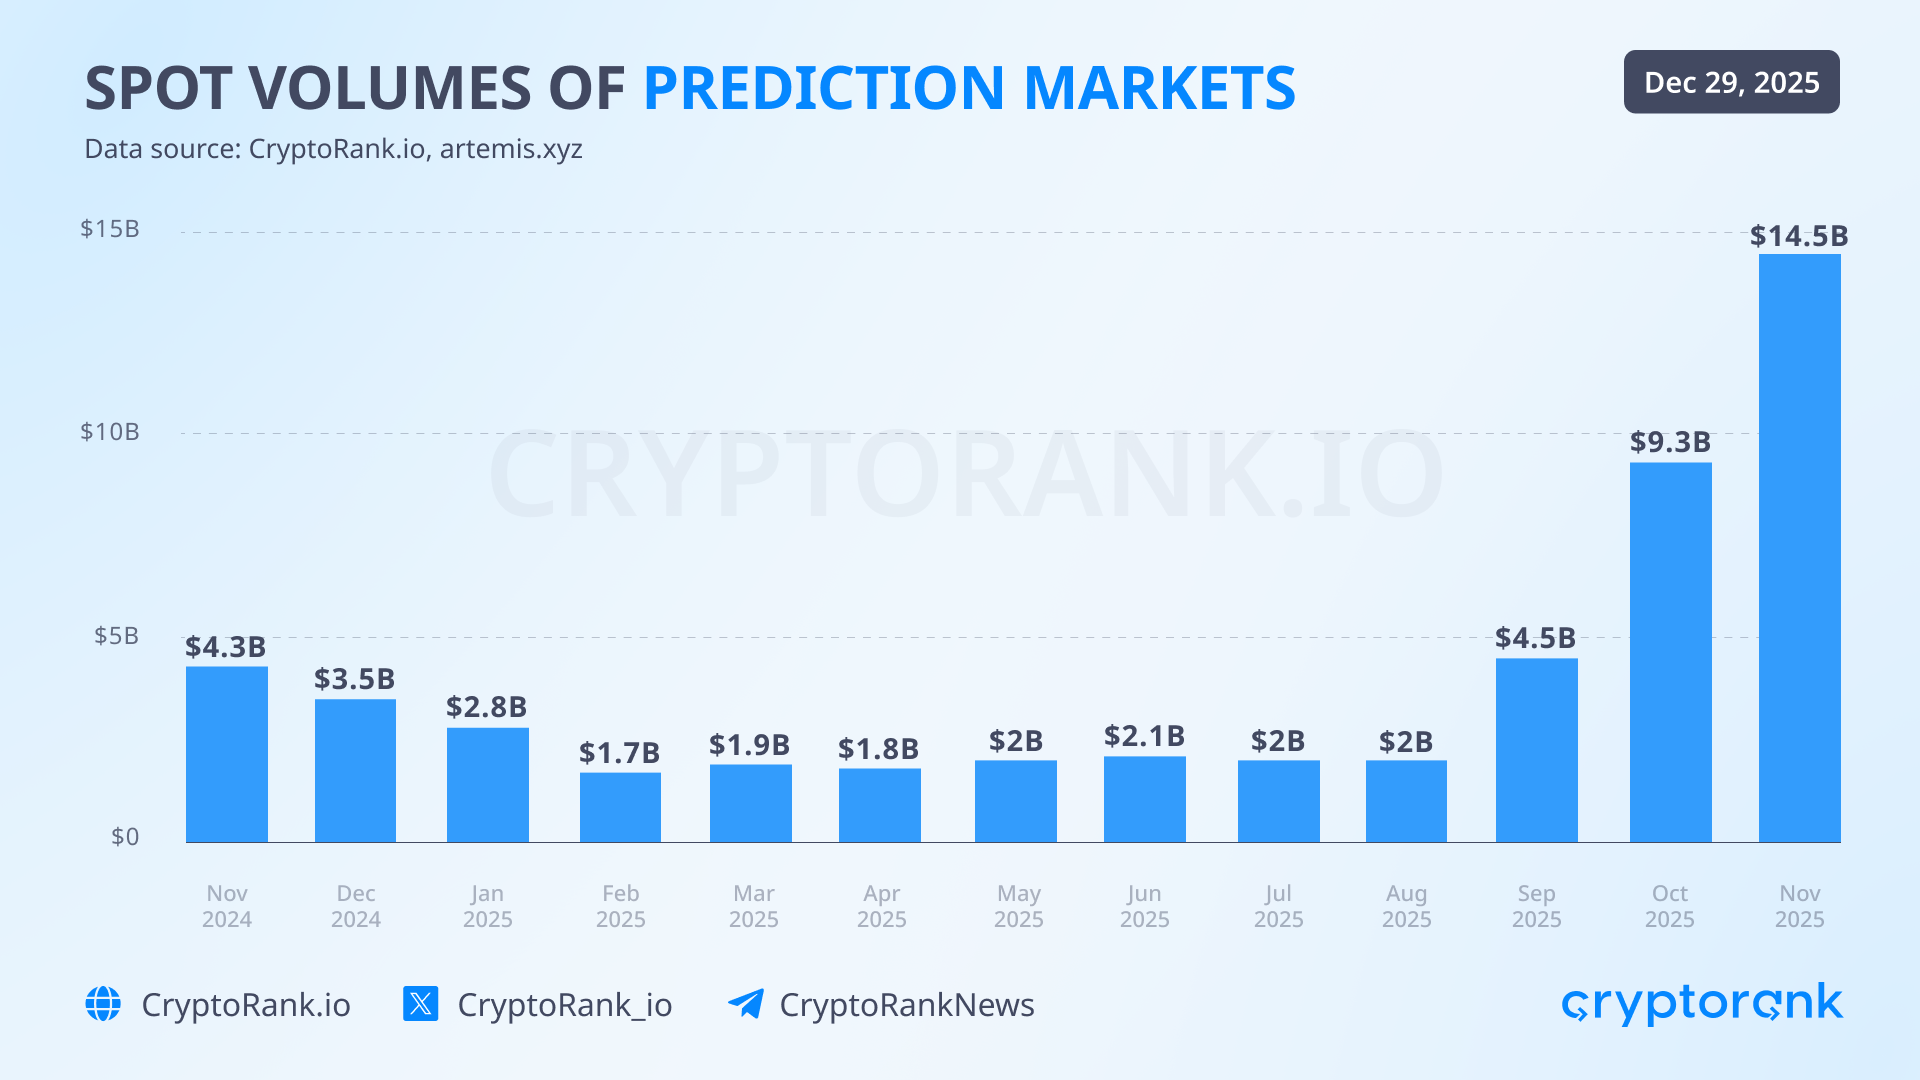
Prediction markets re-emerged as one of the strongest narratives in 2025, capturing significant CT mindshare. Although sector volumes dropped after the US elections in November 2024, user activity and traction returned. Monthly volumes hovered around the $2B level from winter through summer before breaking out in autumn. November marked the best month to date for prediction markets by total volume, reaching $14.5B, which is over 600% growth since February 2025 (the first post-elections month).
Prediction markets reached broader adoption due to several factors, including expansion to new audiences (e.g., Kalshi’s partnership with Robinhood), regulatory progress (e.g., Polymarket’s US comeback), and increased institutional capital support. Another driver of rapid volume growth was the emergence of new prediction dApps across multiple ecosystems, primarily BNB Chain and Solana.
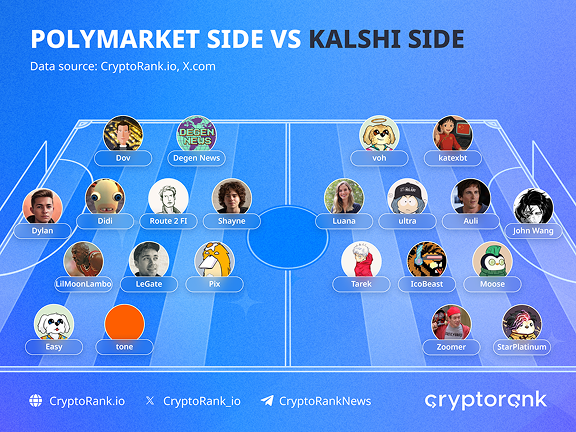
However, the main battle unfolded between two dominant players competing closely across key metrics, Kalshi and Polymarket.
Polymarket
Clearly, the biggest win for Polymarket this year was receiving approval from the Commodity Futures Trading Commission (CFTC) to resume operations in the USю The decision cleared a three-year regulatory cloud and allowed Polymarket to operate again in the globally largest market. The regulator’s decision signaled growing regulatory acceptance of prediction markets.
Another major milestone was securing 3 funding rounds this year: an undisclosed $150M round at a $1.2B valuation led by Founders Fund, a strategic round backed by 1789 Capital, and October’s $2B round at a $9B valuation led by Intercontinental Exchange. The project’s valuation increased 7.5x in less than a year, reflecting strong institutional interest in its business model.
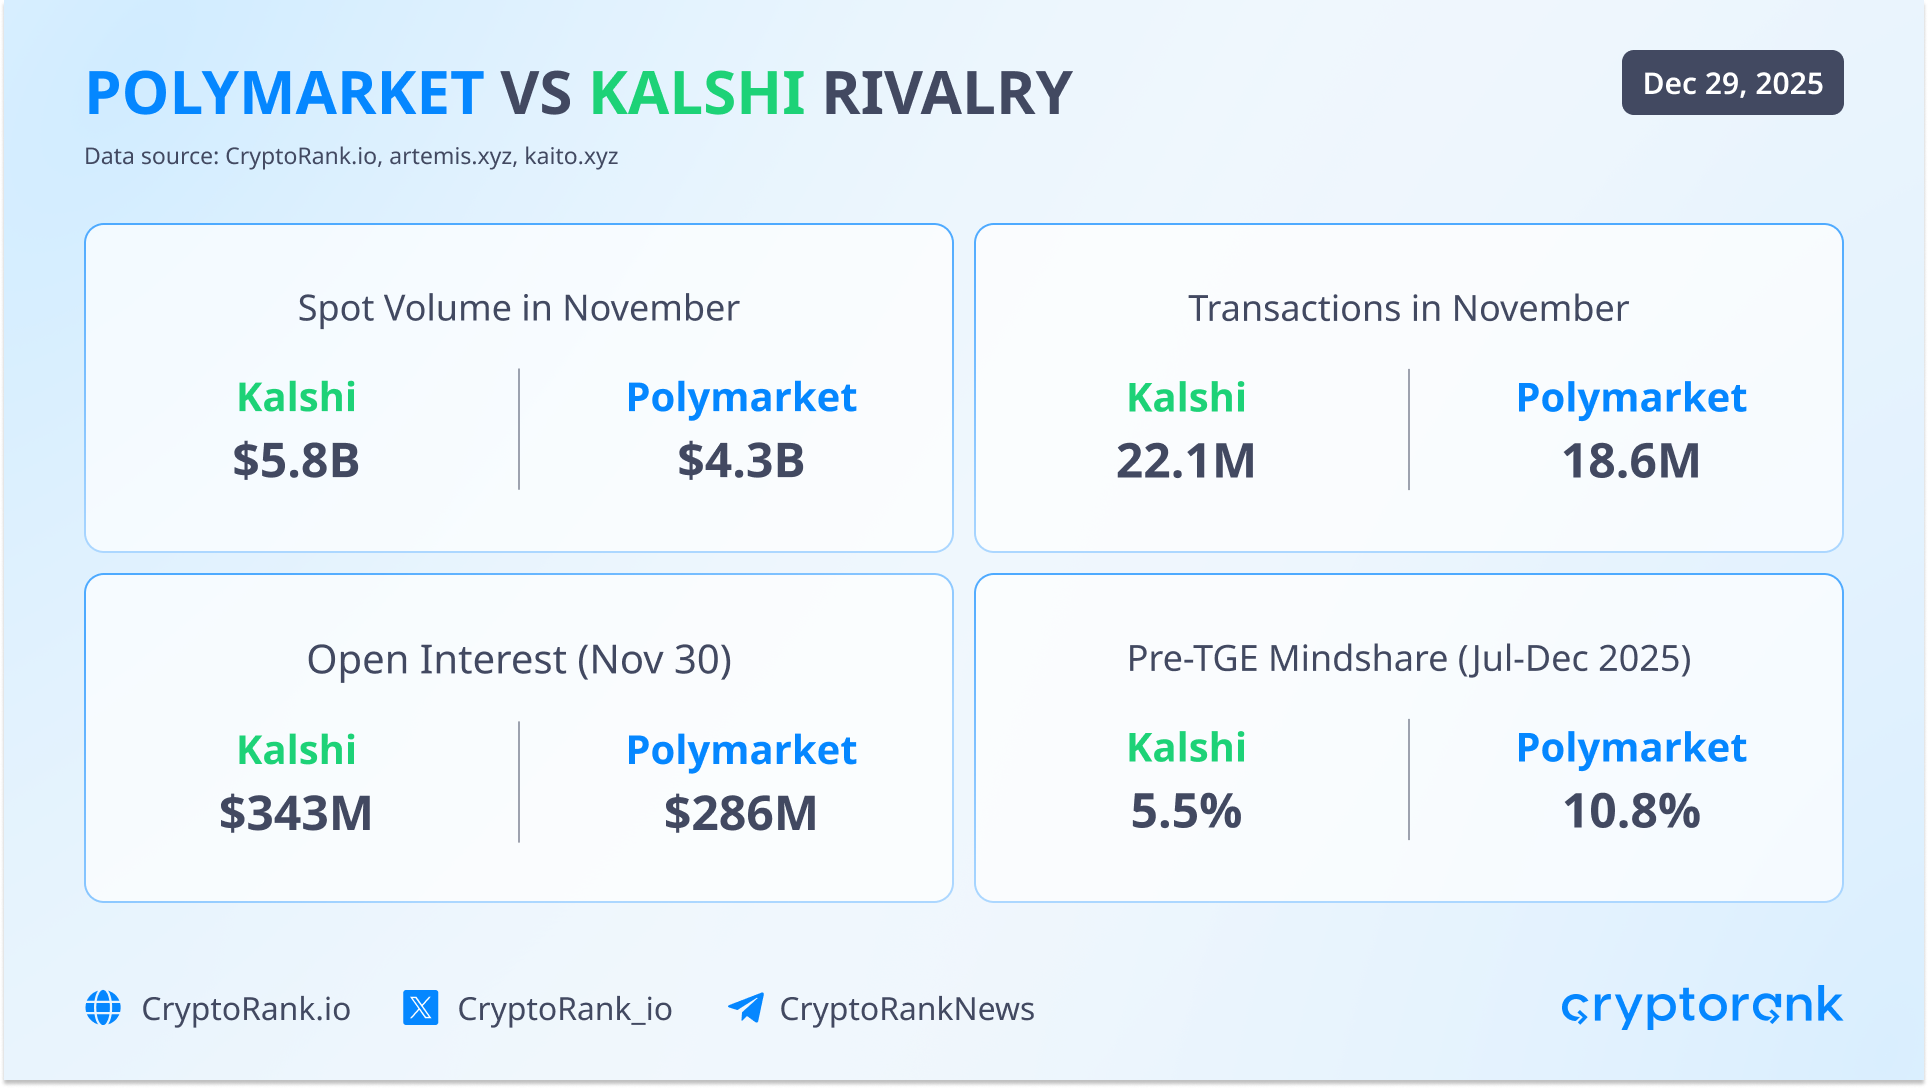
Key metrics improved significantly throughout the year. Monthly volume grew from $1.5B in February to $4.3B in November. Over the same period, spot transactions increased from 3.5M to 18.6M, while open interest rose from $92.6M to $241M.
The Polymarket team also confirmed that the POLY token will launch in 2026, after the US comeback is fully completed. The team is also exploring a potential airdrop for active platform users, which attracted additional attention from market participants.
Kalshi
Like Polymarket, Kalshi secured 3 funding rounds in 2025: a $185M Series C at a $2B valuation in June, a $300M Series D at a $5B valuation in October, and a $1B round in November at an $11B valuation led by Sequoia Capital and CapitalG. These capital inflows supported product expansion, fintech integrations, and infrastructure scaling.
Sports markets remained dominant in Kalshi’s volume with nearly 93% of the total volume. However, Kalshi also took steps to expand into other verticals, including politics and crypto. Kalshi remains a Web2, centralized product but is expanding on-chain by launching tokenized event contracts on Solana and partnering with Pyth Network to stream real-time, regulated market data on-chain. To attract a crypto-native audience, the platform onboarded several well-known CT influencers, including John Wang, ICO Beast, and 0xultra.
Kalshi also expanded into consumer markets through partnerships such as StockX, allowing users to trade outcomes tied to sneaker resale prices, collectible demand, and brand performance during major retail periods. Alongside larger integrations, such as with Robinhood, users gained access to trading outcomes of professional and college football games via a CFTC-regulated prediction market directly within the broker’s app.
At the same time, regulatory challenges remain. Several US states continue to classify Kalshi’s contracts as gambling, and the company is actively appealing these rulings.
Kalshi’s metrics grew even faster than Polymarket’s over the year. Monthly spot volume rose from $175M in January to $5.8B in November, a 3,200% increase. Spot transactions increased from 1.4M to 22.1M, while open interest surprisingly declined from $476M to $335M.
Beyond the two leaders, several emerging players are also competing for market share. One of the most notable is Opinion, backed by YZi Labs, which raised a $5M round this year and ranked second by spot volume at $1.4B as of December 21. Another BNB ecosystem project is Probable, also incubated by YZi Labs.
Perp DEX Competition Intensifies: Hyperliquid, Aster, Lighter Performance
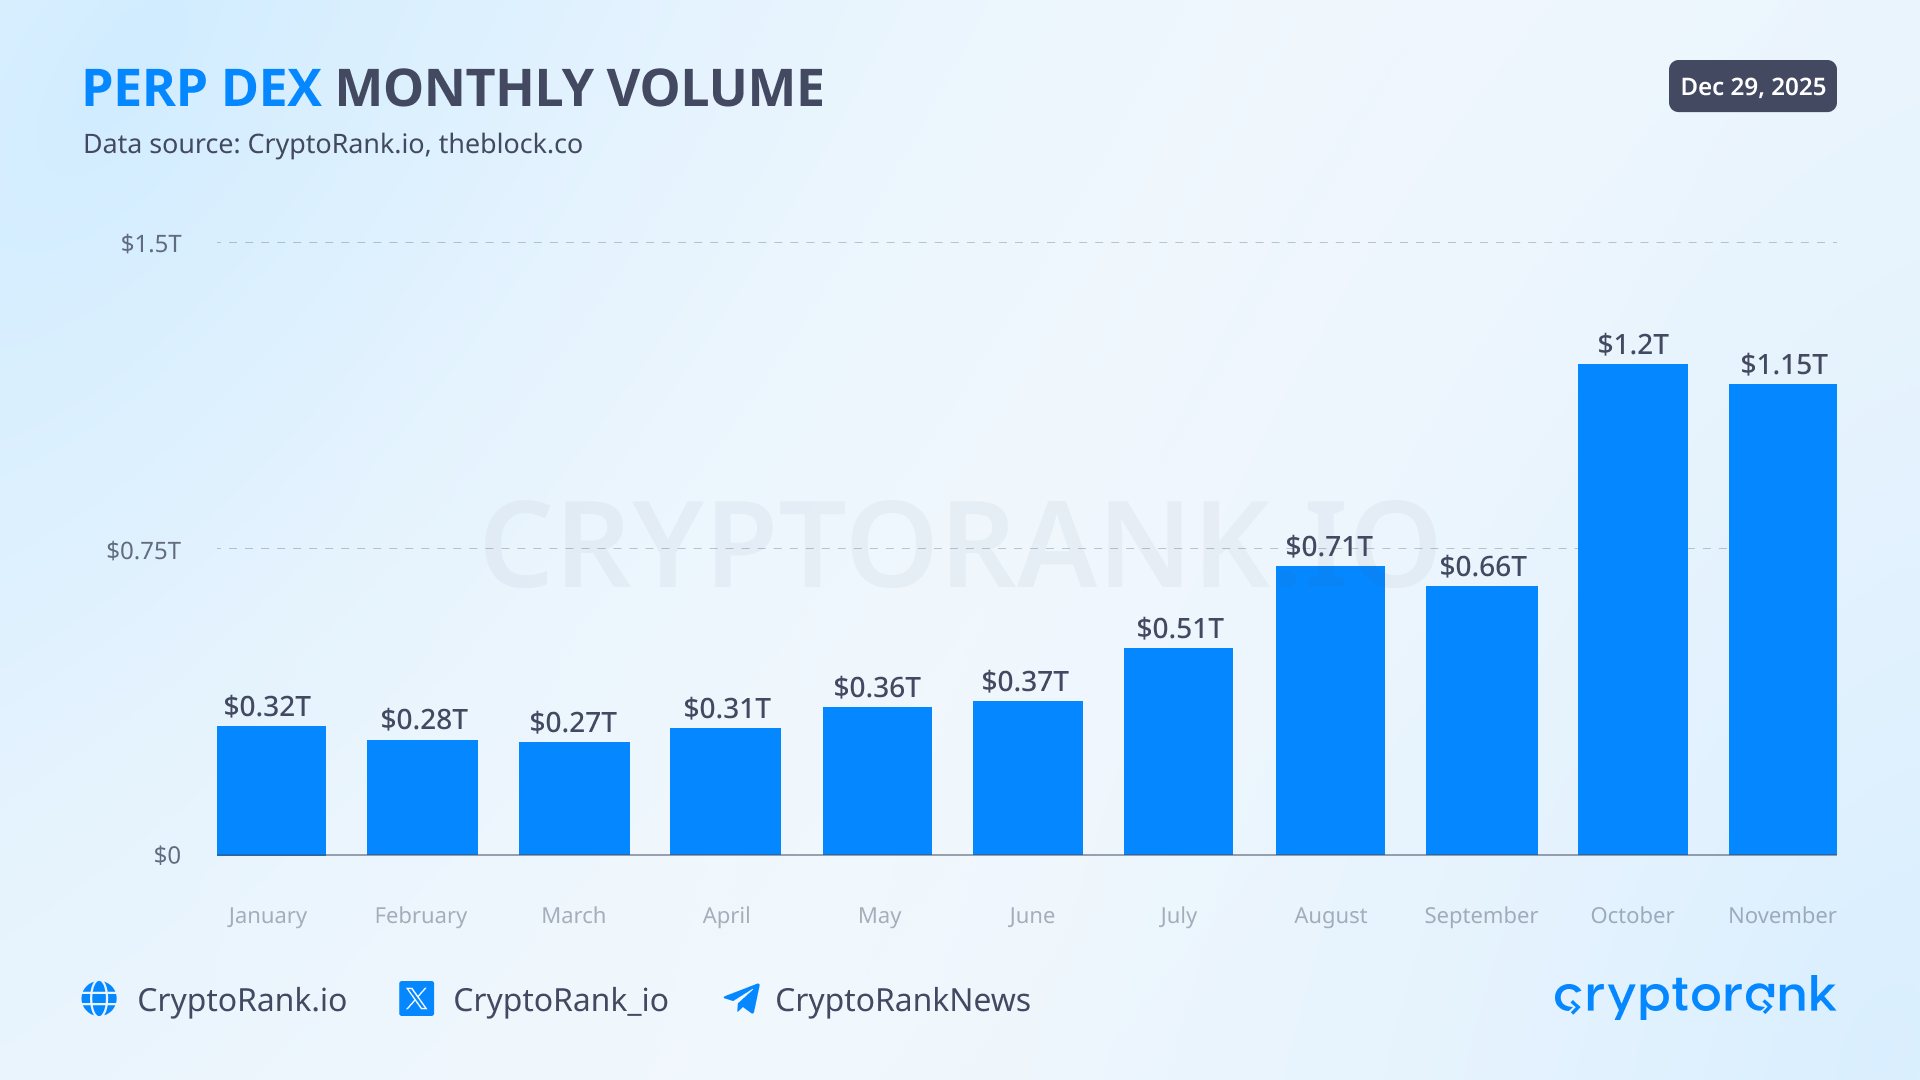
Perpetuals DEXs reappeared as one of the strongest narratives in 2025, as many traders shifted their attention from memecoins to perp trading. This resulted in record trading volumes; October 2024’s $89B grew to $1.8T in October 2025, an outstanding 20x increase. Perp DEXs also started to take a meaningful share of CEX trading volume. This year, the DEX-to-CEX perps volume ratio jumped from 4% to 12%.
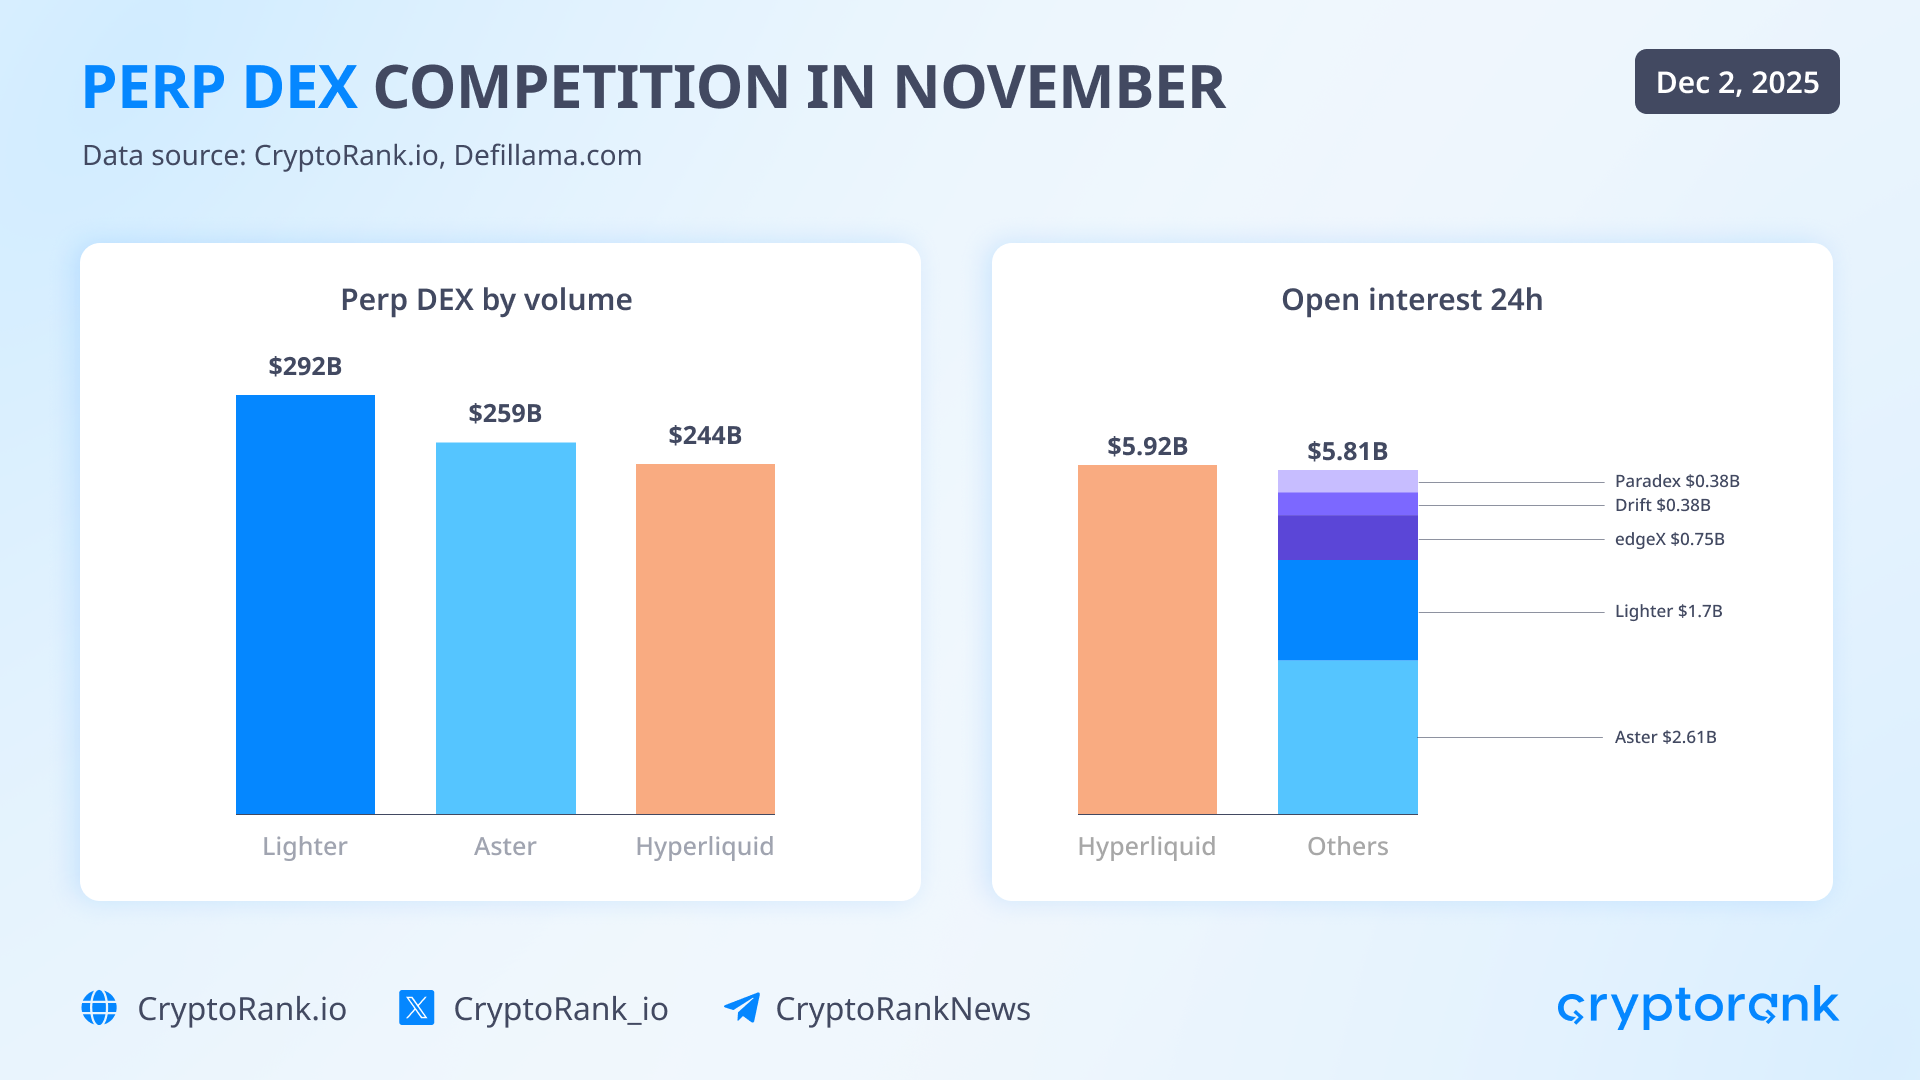
The key reason behind this surge is a structural change in the sector’s competitive landscape. Throughout the year, on-chain perp trading evolved from a near-monopolistic setup dominated by Hyperliquid into a highly competitive environment, where multiple projects now compete for user attention and liquidity.
Projects rolling out their own trading-focused chains became another notable trend in 2025. Lighter and edgeX developed chains optimized for low latency, high throughput, and high-frequency trading. Another key player, Aster, is also working on its own L1, targeting a launch in Q1 2026.
Hyperliquid’s year was relatively controversial. It remained one of the most profitable projects in crypto, generating $902M in fees and $837M in revenue in 2025. Perp volume grew significantly year over year, from $564B to $2.9T, while open interest exceeded $13B at its peak.
However, since August, Hyperliquid’s stats have started to fall. Monthly perp volume fell by roughly 60%, marking the first time in over a year that Hyperliquid lost its volume lead. At the same time, open interest declined by 60%. As noted earlier, the rise of new competitors played a major role in this shift. Both Aster and Lighter launched incentive programs, which helped attract a large audience of airdrop hunters.
On the one hand, their explosive growth proved that money flows where rewards are. It highlights how difficult user loyalty is to achieve in the crypto industry, even for Hyperliquid, which arguably has one of the strongest communities in Web3. On the other hand, we are about to see whether Aster and Lighter will be able to retain traders when incentive campaigns are over. This is what Hyperliquid has been able to achieve, thanks to its advanced tech (CLOB engine), convenient UI, and wide asset list.
Aster became one of the sector’s leading perp platforms almost immediately after its September launch. The debut coincided with the ASTER token’s TGE, during which the token surged roughly 10x in its first week. Activity metrics were strong from the start. At one point, the project reported billions in daily trading volume and millions of traders.
That rapid rise, however, drew close scrutiny from the market. Concerns over the accuracy of reported volumes and token distribution concentration led some data aggregators to temporarily remove Aster’s metrics. After these issues were addressed, Aster regained visibility and continues to rank among the top three perpetual DEXs by trading volume and fees.
Lighter is built on a custom zk-rollup deployed on Arbitrum. All trades, liquidations, and settlements are verified using zero-knowledge proofs, providing cryptographic guarantees around execution that currently exceed what most competitors offer.
Lighter’s strongest competitive advantage is zero trading fees. Instead, the platform generates revenue through Payment for Order Flow (PFOF), where user orders are routed to market makers in exchange for a fee. This allows traders to trade without commissions, while market makers earn from spreads and the exchange captures revenue from liquidity providers.
This model, combined with an active incentive program, proved highly effective for Lighter. In November, it became the leading perp DEX by volume, processing roughly $300B.
Outlook for 2026
Institutional adoption will remain the primary growth driver for the crypto market. This will accelerate the development of institution-oriented segments such as RWAs, stablecoins, low-risk DeFi, and enterprise-grade payment and custody infrastructure. As a result, more B2B-focused projects will enter the space, explicitly designed to meet institutional requirements. These projects are often non-tokenized and largely ignored by retail investors, yet they will play a decisive role in shaping the long-term structure of the industry.
At the same time, the retail segment is undergoing a structural shift toward deeper integration with traditional finance. Crypto products are moving away from an inward, crypto-native focus, toward broader, mainstream use cases. Instead of solving niche Web3 problems, leading projects are targeting universal financial needs such as payments, savings, and access to financial instruments.
Another emerging trend is the convergence of real, sustainable protocol revenue with token value capture mechanisms. Projects with stable cash flows are increasingly linking financial performance to tokens via buyback-and-burn or similar mechanics. If supported by clear regulatory frameworks, this evolution could mark the beginning of a new phase for the crypto market, one grounded less in speculation and more in measurable economic value.
Disclaimer: This post was independently created by the author(s) for general informational purposes and does not necessarily reflect the views of Algona Business Ltd. The author(s) may hold cryptocurrencies mentioned in this report. This post is not investment advice. Conduct your own research and consult an independent financial, tax, or legal advisor before making any investment decisions. The information here does not constitute an offer or solicitation to buy or sell any financial instrument or participate in any trading strategy. Past performance is no guarantee of future results.
Without the prior written consent of CryptoRank, no part of this report may be copied, photocopied, reproduced or redistributed in any form or by any means.
In This Insight
Coins


In This Insight
Coins
Share: