Solana price drops to key support despite soaring on-chain metrics

Share:
Solana (SOL) price dropped to $117.38, down 52% from its September high, despite strong fundamentals and transaction growth. It managed over 2 billion transactions in 30 days, significantly higher than Ethereum's 64 million. SOL's DEX volume reached $107 billion, surpassing competitors, while ETF inflows remained positive amidst a broader crypto market decline due to external factors.
Predictions Markets
See what traders are focused on


Solana price dropped to a crucial support level on Monday morning as Bitcoin and most altcoins retreated. It plunged to a low of $117.38, its lowest level in December last year, and 52% below the September high of $253. This article explores why SOL price slumped despite its strong fundamentals.
Solana price dropped as its fundamentals improve
SOL price remained on edge as third-party data showed that its fundamentals remained strong ahead of the upcoming Alpenglow upgrade, which is set to happen either in February or March.
Data compiled by Nansen shows that Solana’s transactions and fees continued rising in the past 30 days, making it the most active network in the crypto industry.
Solana’s network handled over 2 billion transactions in the last 30 days, much higher than what other networks like Ethereum, Base, and BSC Chain handled. Its active addresses jumped by 43% to over 85.3 million.
This transaction growth was due to its strong performance in the meme coins, decentralized exchange (DEX), stablecoins, and real-world asset (RWA) tokenization industry.
This growth led to a jump in network fees, which is important as Solana burns its fees, reducing the circulating supply. Fees jumped by 53% in the last 30 days to over $21 million, making it the second largest chain after Tron, which made over $27 million in fees.

Solana’s metrics are much better than those of Ethereum by far. For example, while its transaction count jumped to over 2.07 billion, Ethereum handled over 64 million transactions in the same period. Also, its fees were much higher than Ethereum’s 10 million.
More data shows that its DEX network is thriving and beating Ethereum. Its DEX volume rose to $107 billion in the last 30 days, higher than Ethereum’s $45 billion and BSC’s $47 billion. The top DEX protocols on Solana were Pump.fun, BisonFi, HumidiFi, Meteora, Raydium, and Jupiter.
Meanwhile, spot Solana ETFs did better than Bitcoin and Ethereum last week, a sign of resilient demand. These funds attracted over $9.5 million in inflows last week, meaning that they have never had a weekly outflow. In contrast, spot XRP ETFs shed over $40 million in assets last week. Bitcoin and Ethereum ETFs shed over $1.3 billion and $611 million, respectively.
Therefore, Solana’s price is dropping because of external factors, including the ongoing crypto market crash. This decline is happening as investors react to the ongoing geopolitical tensions, as the US builds an armada in the Middle East. Donald Trump has also continued to warn about new tariffs against Canada.
SOL price prediction: Technical analysis

The three-day timeframe chart shows that the SOL token has crashed from a high of $253 on September 16 last year to a low of $117.38. It has remained below the 50-day and 100-day Exponential Moving Averages (EMA).
The coin has now formed a bearish flag, which happens after a big drop. Its lower side is at $117.38. It has moved below all moving averages and the Supertrend indicator.
Therefore, a drop below the key support level at $117.38 will point to more downside, potentially to the key support level at $95, its lowest level on April 7. Such a drop would point to a 23% decline below the current level.
The post Solana price drops to key support despite soaring on-chain metrics appeared first on Invezz
In This News
Coins

$ 64.11K
+0.28%
$ 1.79K
+1.25%
$ 1.11
-0.11%
$ 0.330
-0.48%
$ 77.67
-1.66%


Predictions Markets
See what traders are focused on
Share:
In This News
Coins
$ 64.11K
+0.28%$ 1.79K
+1.25%$ 1.11
-0.11%$ 0.330
-0.48%$ 77.67
-1.66%Predictions Markets
See what traders are focused on
Share:
Read More
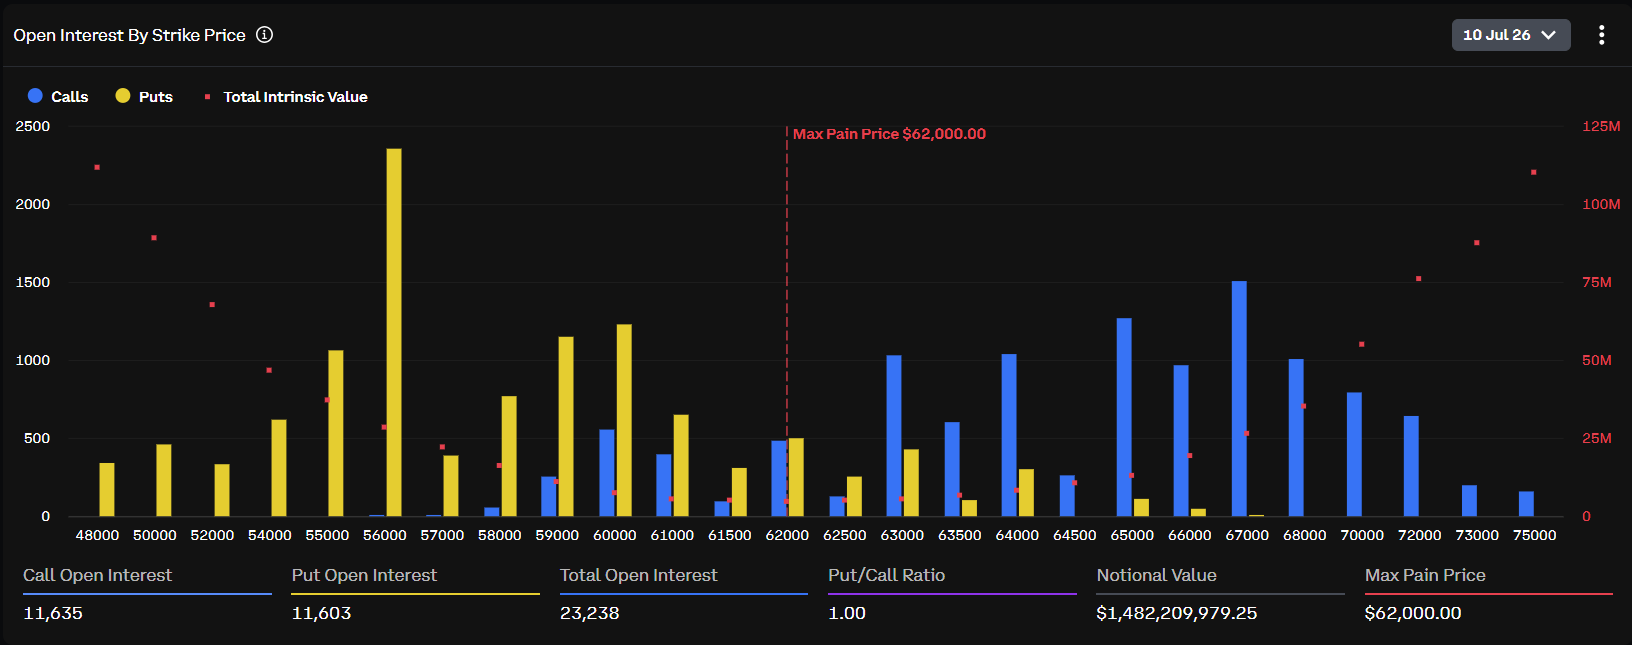
Crypto Market Eyes Bitcoin, ETH, XRP, SOL Max Pain Price as CPI Data Looms