Crypto Market Recap: April 2025
Share:
Share:
Macro Situation: April Market Disruption
April was a highly disruptive month for the global economy, affecting multiple markets — including crypto. The primary catalyst was Donald Trump’s aggressive tariff policy, which signaled a potential rewiring of global supply chains and trade dynamics. Although Trump had long voiced support for tariffs, the speed and boldness of his implementation surprised many. Eventually, he opted for a more gradual approach, easing some of the market panic.
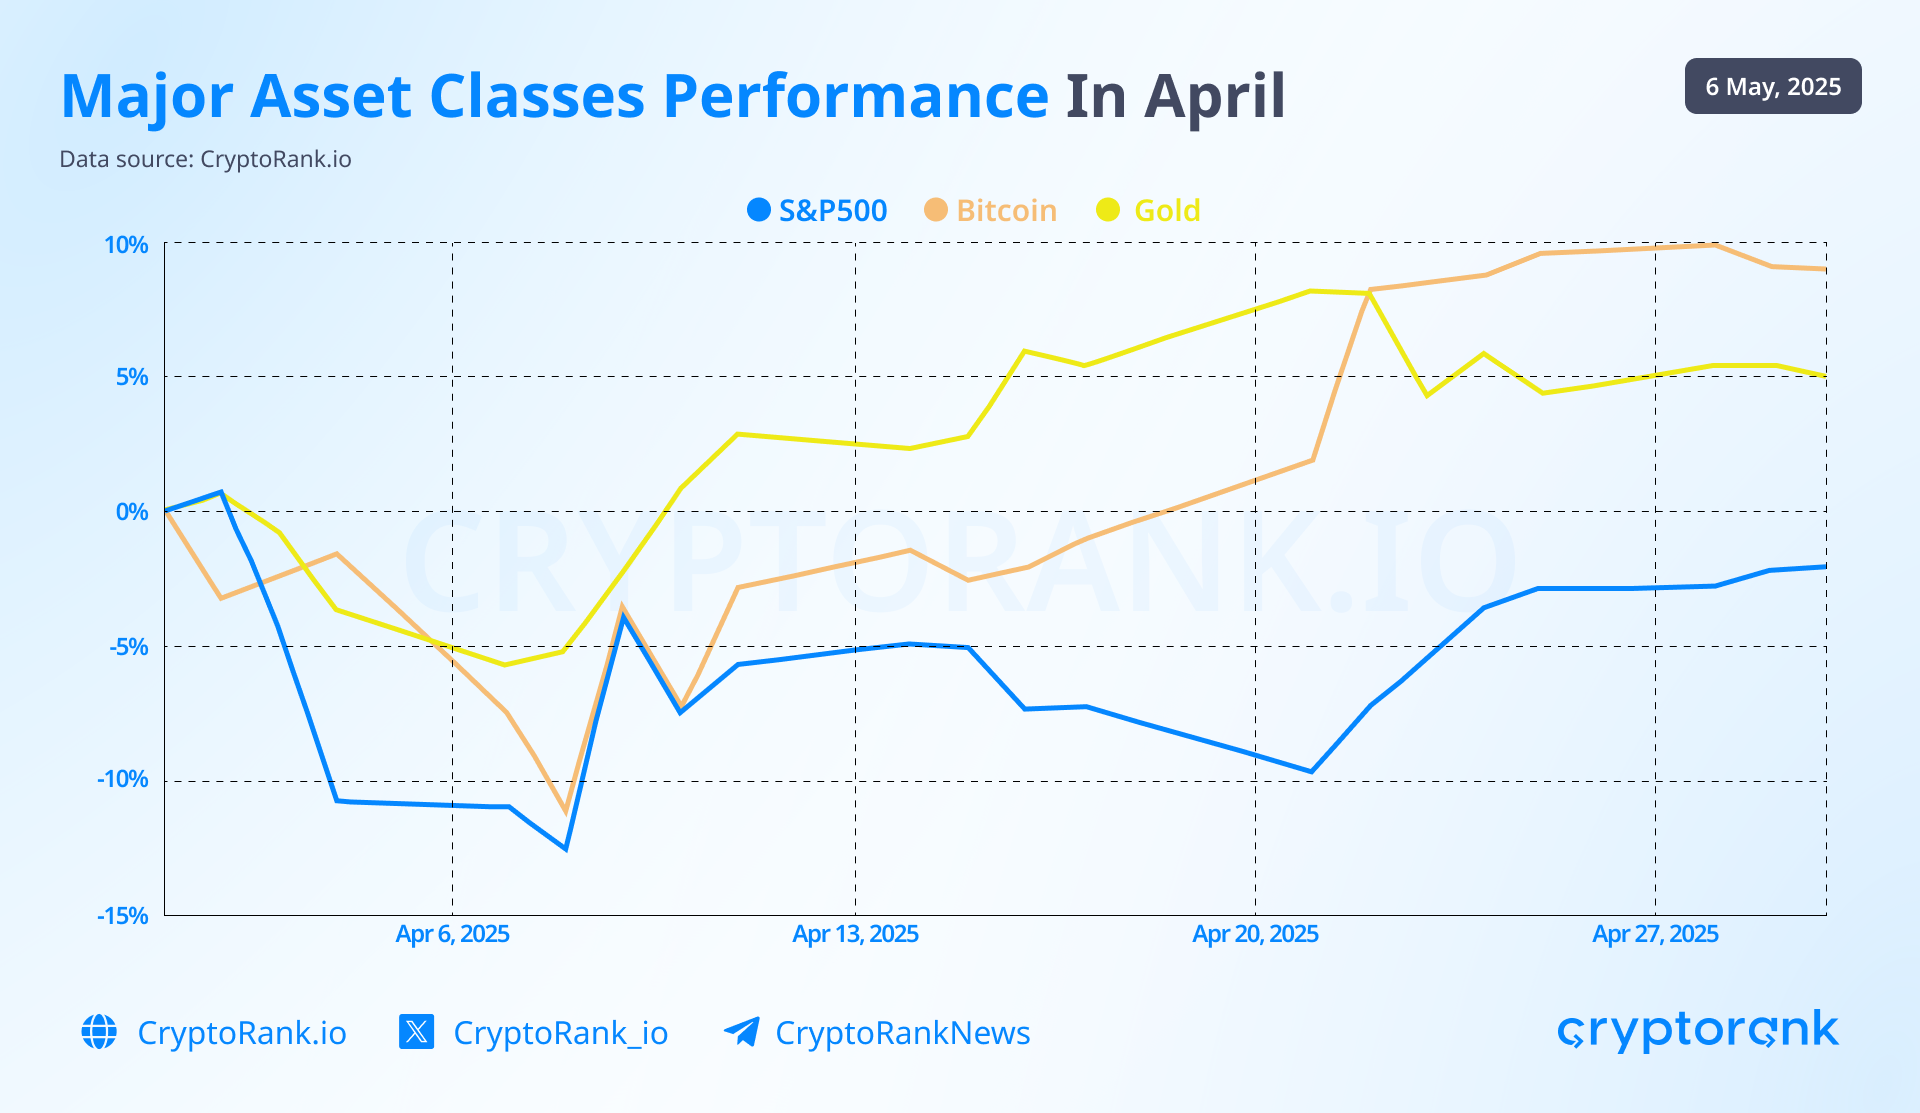
Trump’s policy shifts left a clear footprint on the price movements of major asset classes. Let’s walk through the key events and observe their impact on Bitcoin, the S&P 500, and gold.
Timeline of Events and Market Reactions
April 2
At a White House Rose Garden event dubbed “Liberation Day,” Trump unveiled a “reciprocal tariff” policy. A blanket 10% tariff was imposed on all nations exporting to the U.S., with steeper rates for specific countries — including close allies.
Following this, both the S&P 500 and Bitcoin extended their March declines. Even gold, which had previously risen as a risk hedge during equity sell-offs, began to dip.
April 4
China retaliated with a 34% tariff on U.S. imports and banned 11 American companies from operating domestically.
The tit-for-tat escalation deepened market anxiety, accelerating the sell-off across equities and crypto.
April 9
Trump’s tariffs took effect: 104% on Chinese goods, 20% on EU goods, 24% on Japanese, and 46% on Vietnamese imports. China responded with an 84% tariff on U.S. goods. The EU also threatened countermeasures.
Markets plummeted globally, with some indices experiencing losses not seen in decades.
Later that day, Trump announced a 90-day pause on most tariffs — except those on China, which were increased to 125%.
This reversal sparked a relief rally across markets.
April 10
The White House clarified the full tariff rate on Chinese goods as 145%. The EU temporarily paused its retaliatory measures.
Markets reacted negatively, with a slight pullback in the S&P 500 and Bitcoin, while gold resumed its upward trajectory.
April 11
Trump exempted several categories of electronics — including smartphones and semiconductors — from tariffs.
This eased investor concerns and helped Bitcoin and the S&P 500 recover the previous day’s losses.
April 13
The White House announced that electronics exemptions were only temporary and hinted at new tariffs on computer chips.
By now, markets showed signs of fatigue, appearing less reactive to sector-specific tariff news. Gold continued to climb as a hedge, while Bitcoin and equities diverged temporarily until April 21, when they synchronized again amid renewed S&P 500 growth. Bitcoin demonstrated a higher upside response.
April 29
Trump signed executive orders adjusting auto industry tariffs to avoid overlap with existing duties on steel and aluminum.
Markets appeared to await more decisive signals. Cautious optimism emerged, hinging on whether the 90-day pause would lead to lasting de-escalation.
Conclusion:
The data show that Trump’s tariff policy left a clear footprint on the price patterns of the S&P 500, Bitcoin, and gold. Compared to the S&P 500, Bitcoin showed notably stronger momentum. Despite a sharp decline early in the month, Bitcoin outperformed both gold and the S&P 500 in April.
The correlation between Bitcoin and the S&P 500 remains strong. In fact, the S&P 500 only slightly outpaced Bitcoin, indicating that BTC closely tracks the index’s movements.
The takeaway is clear and optimistic: Bitcoin mirrors the S&P 500’s behavior but with higher alpha.
Data source: CryptoRank API
Bitcoin
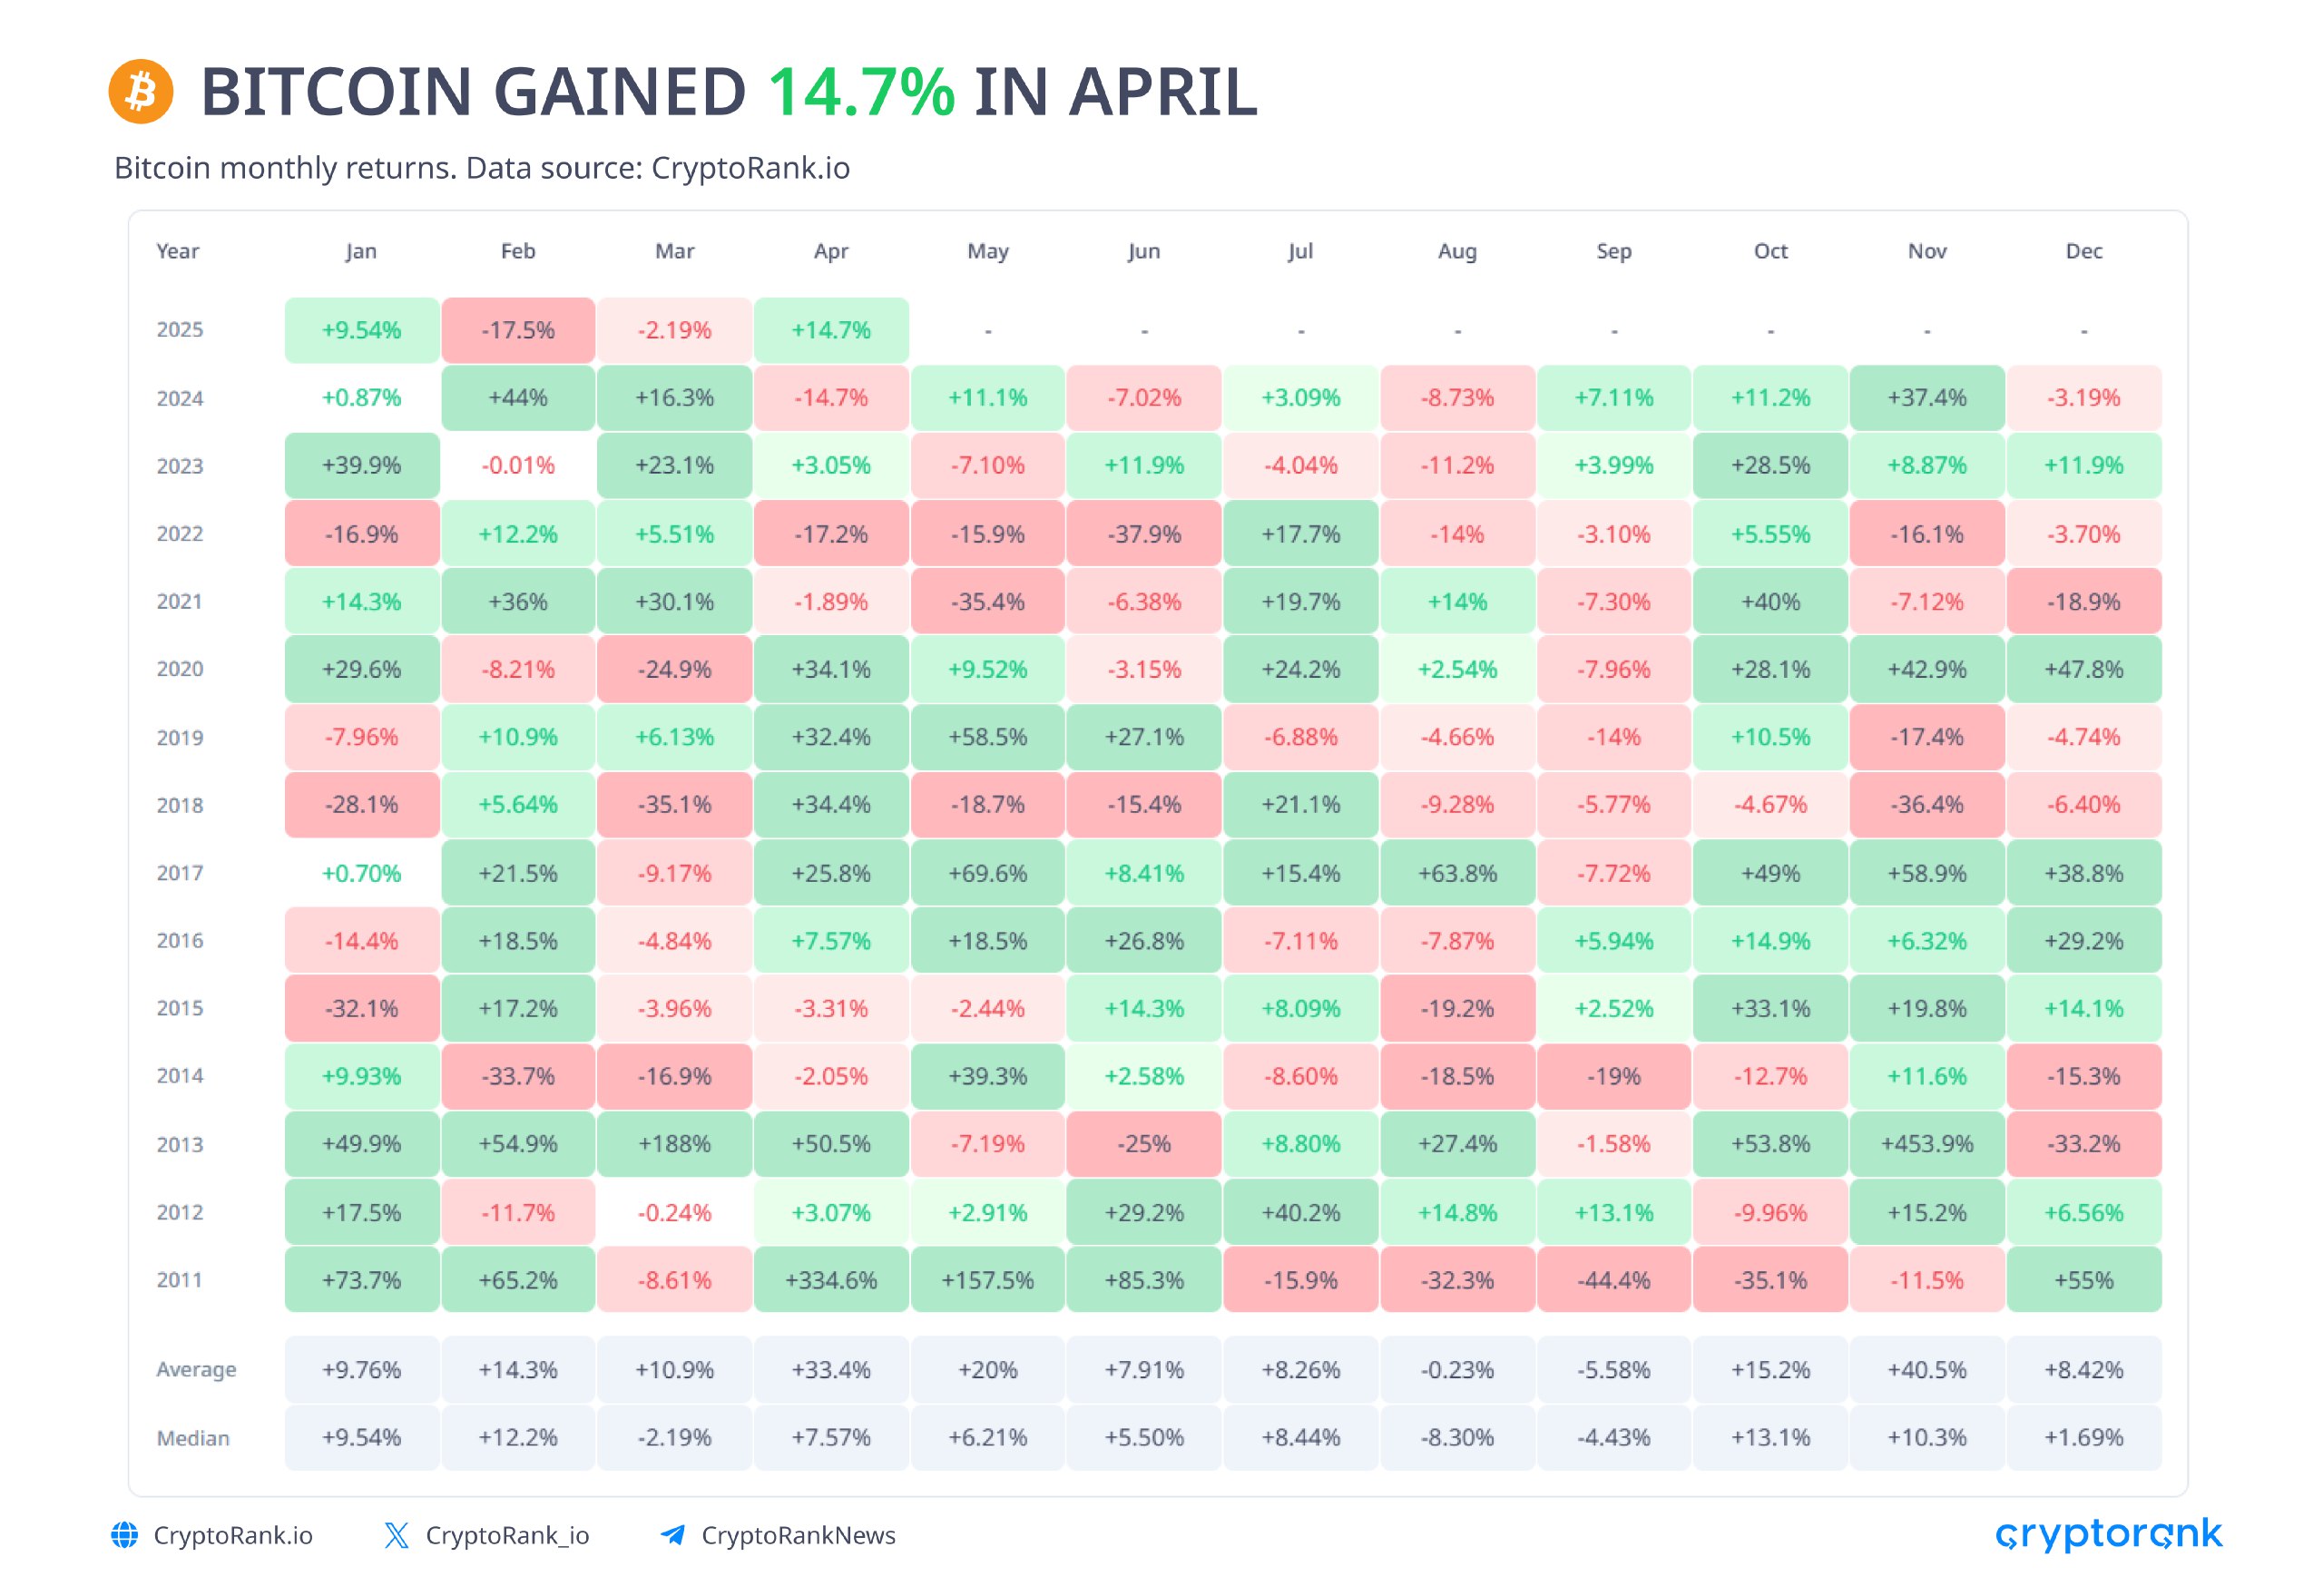
Bitcoin showed significant price growth in April and demonstrated a strong ability to rebound quickly. So far, April has been the best-performing month for Bitcoin in 2025 in terms of price increase — partly due to a low base effect and a recovery from the February dip.
Data obtained by API
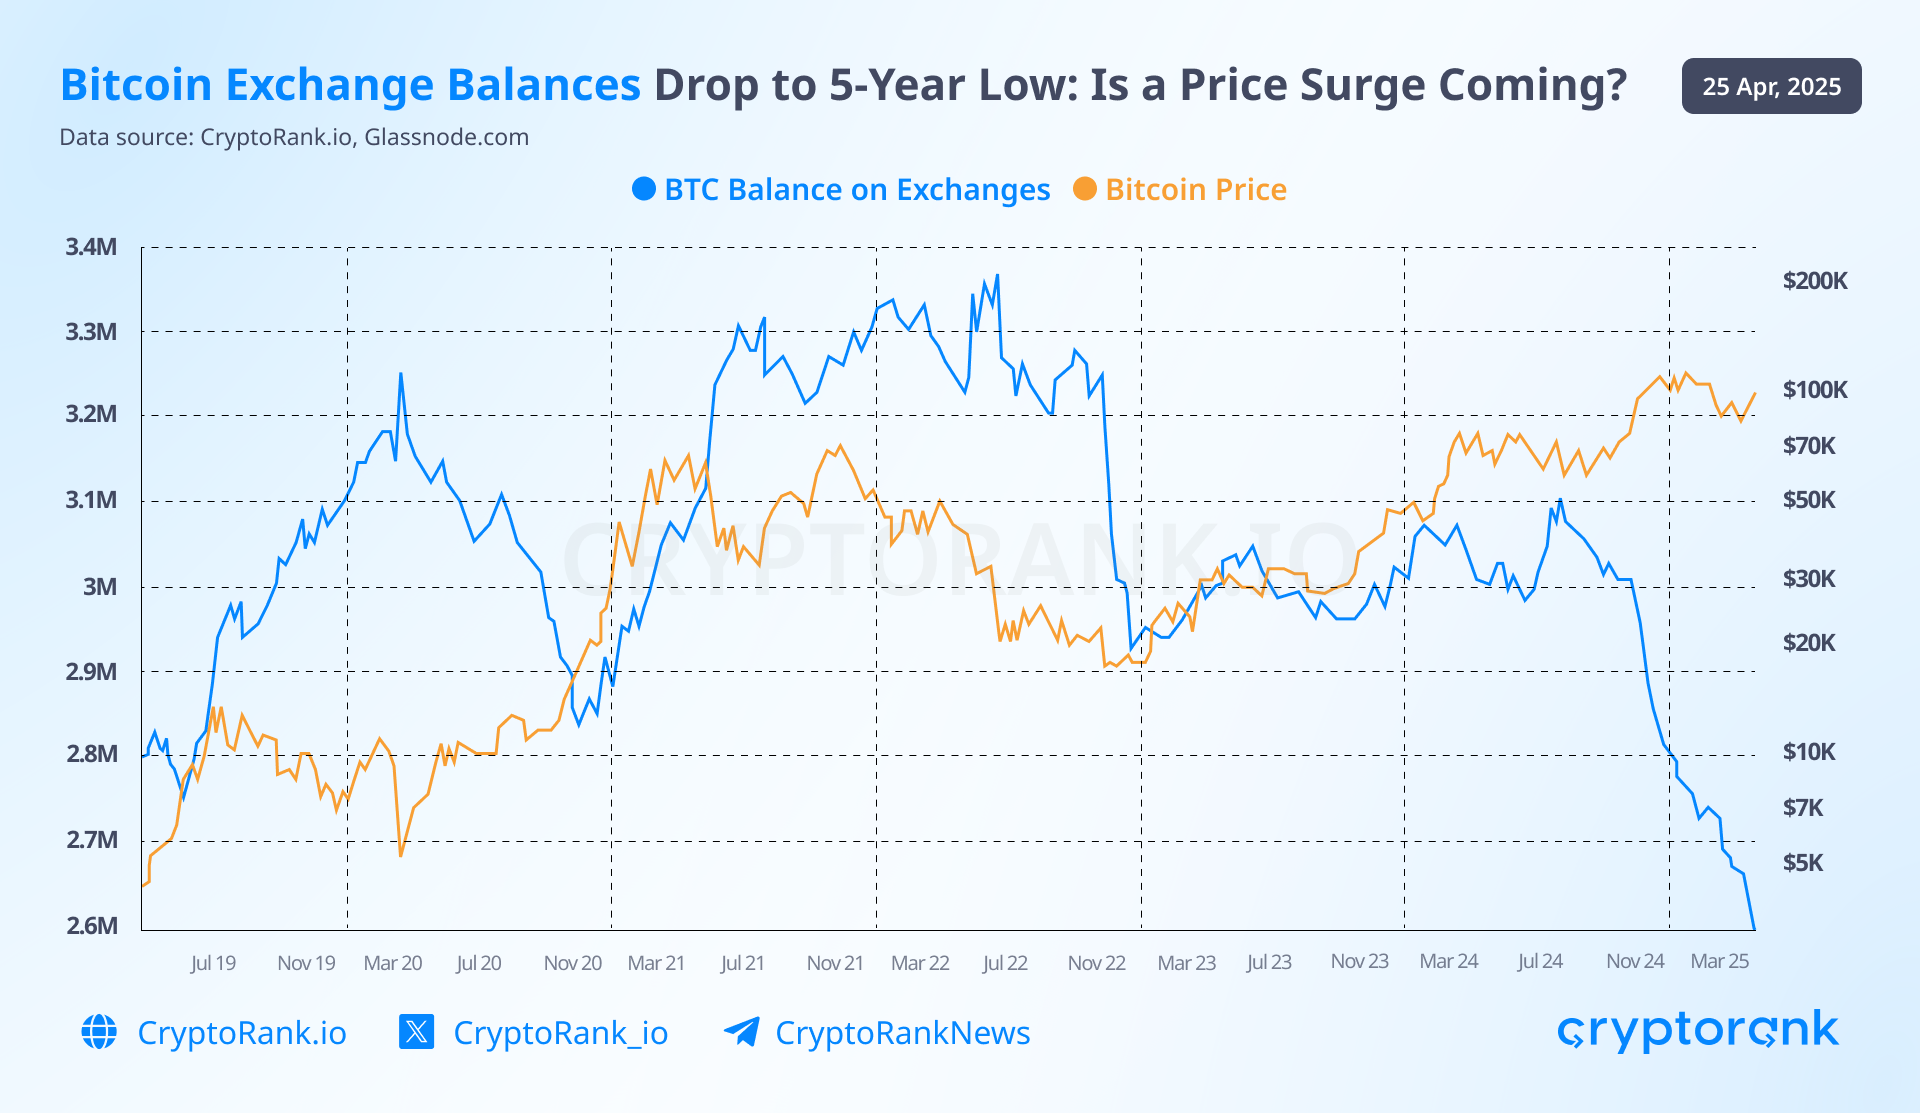
Additional indirect indicators also point to rising demand for Bitcoin. Currently, the amount of Bitcoin held on centralized exchanges (CEXs) has dropped to its lowest level in five years. Historically, such declines have often preceded price increases, as illustrated in the chart.
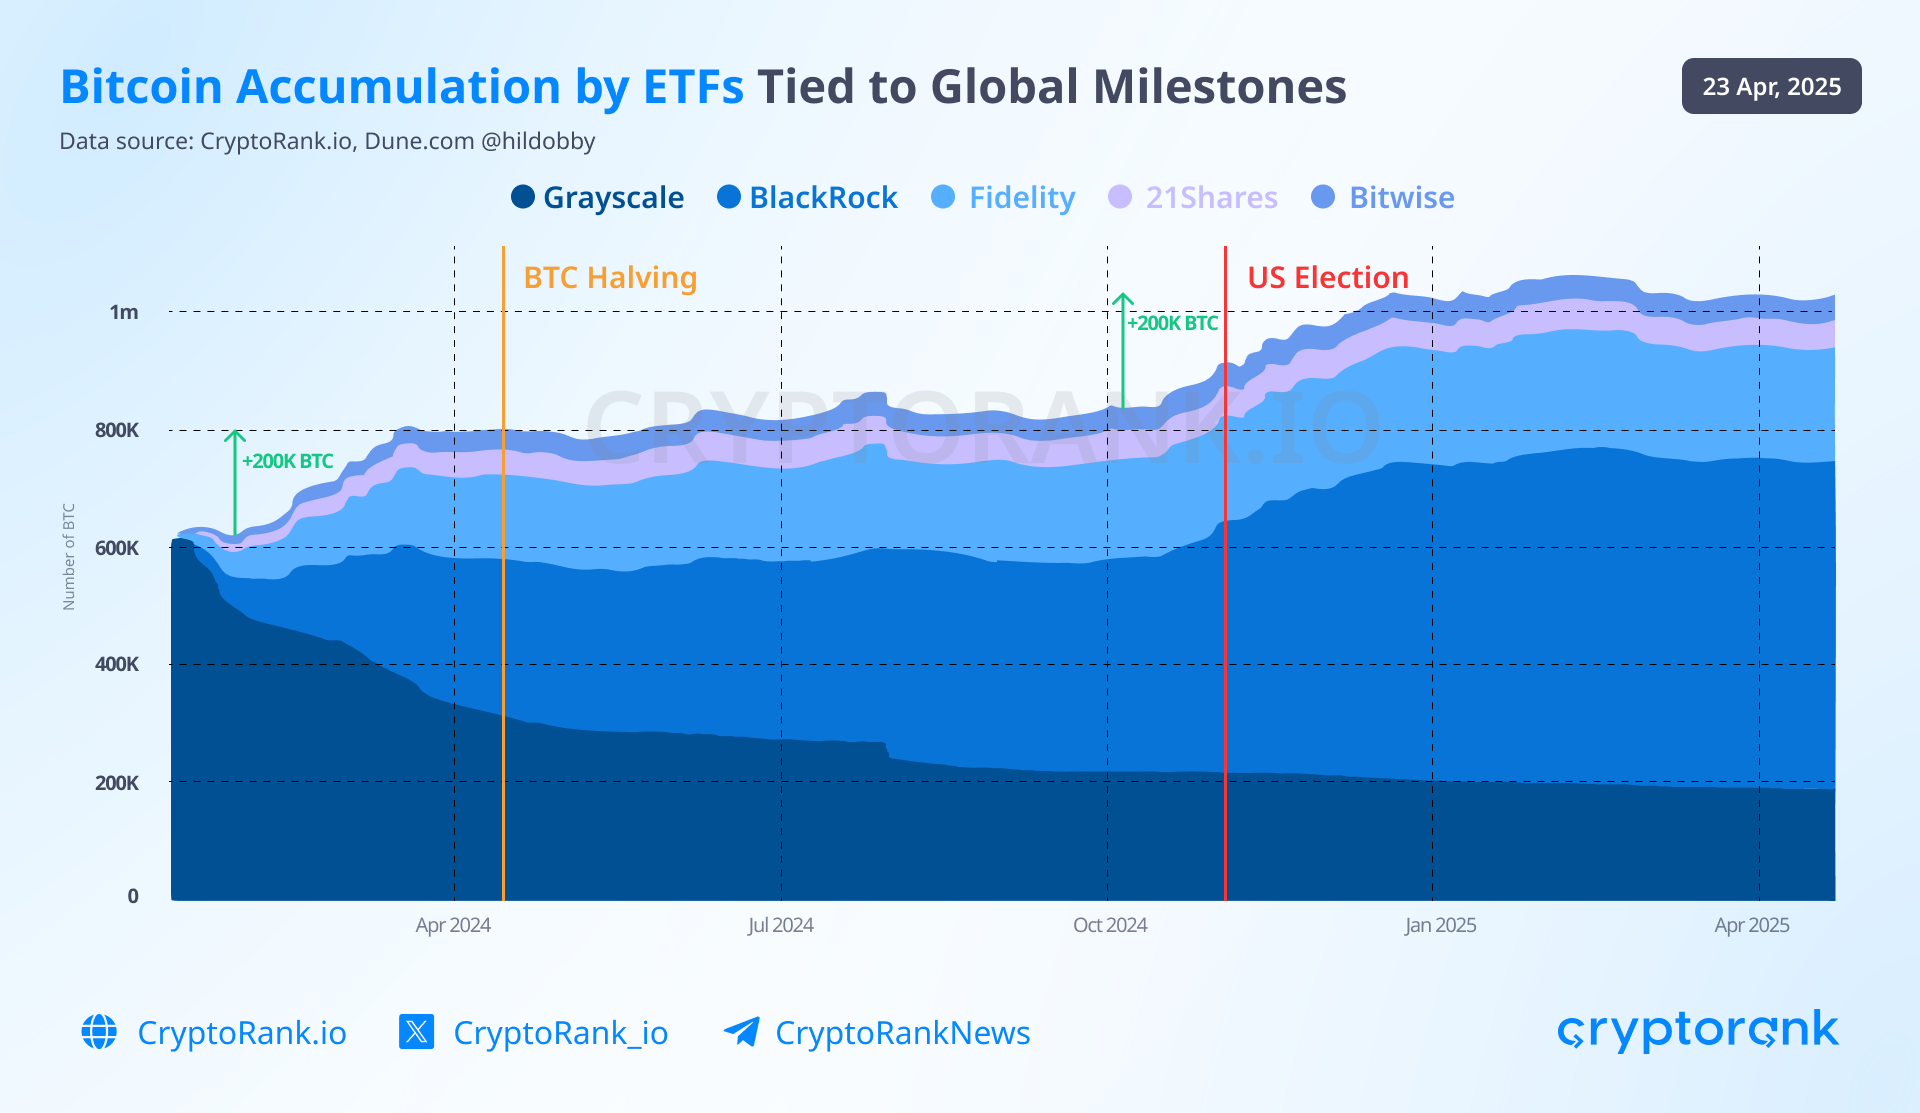
Since the launch of spot Bitcoin ETFs, we’ve seen a gradual increase in the number of Bitcoins held by these funds. Notably, demand for Bitcoin ETFs tends to rise ahead of major events — such as the halving and the U.S. presidential elections. Outside of those periods, the number of Bitcoins held in ETFs has remained relatively stable.
Several conclusions can be drawn from this:
-
The number of Bitcoin in ETFs is steadily growing. So far, we haven’t observed any major drawdowns in ETF holdings — even during periods of weak price performance and market pessimism, such as the summer and early autumn of 2024.
-
This pattern suggests that Bitcoin is increasingly viewed as a strategic asset in the context of global milestones.
In summary, sustained demand from Bitcoin ETF providers creates upward pressure on Bitcoin’s price. In the event of favorable macroeconomic developments, we may see a sharp inflow of Bitcoin into ETFs — further driving the price higher.
Ethereum
April was less favorable for Ethereum, which saw a slight decline in price — in stark contrast to Bitcoin’s strong rally. So far, Ethereum has not been able to recover from the steep losses it suffered in February and March of this year.
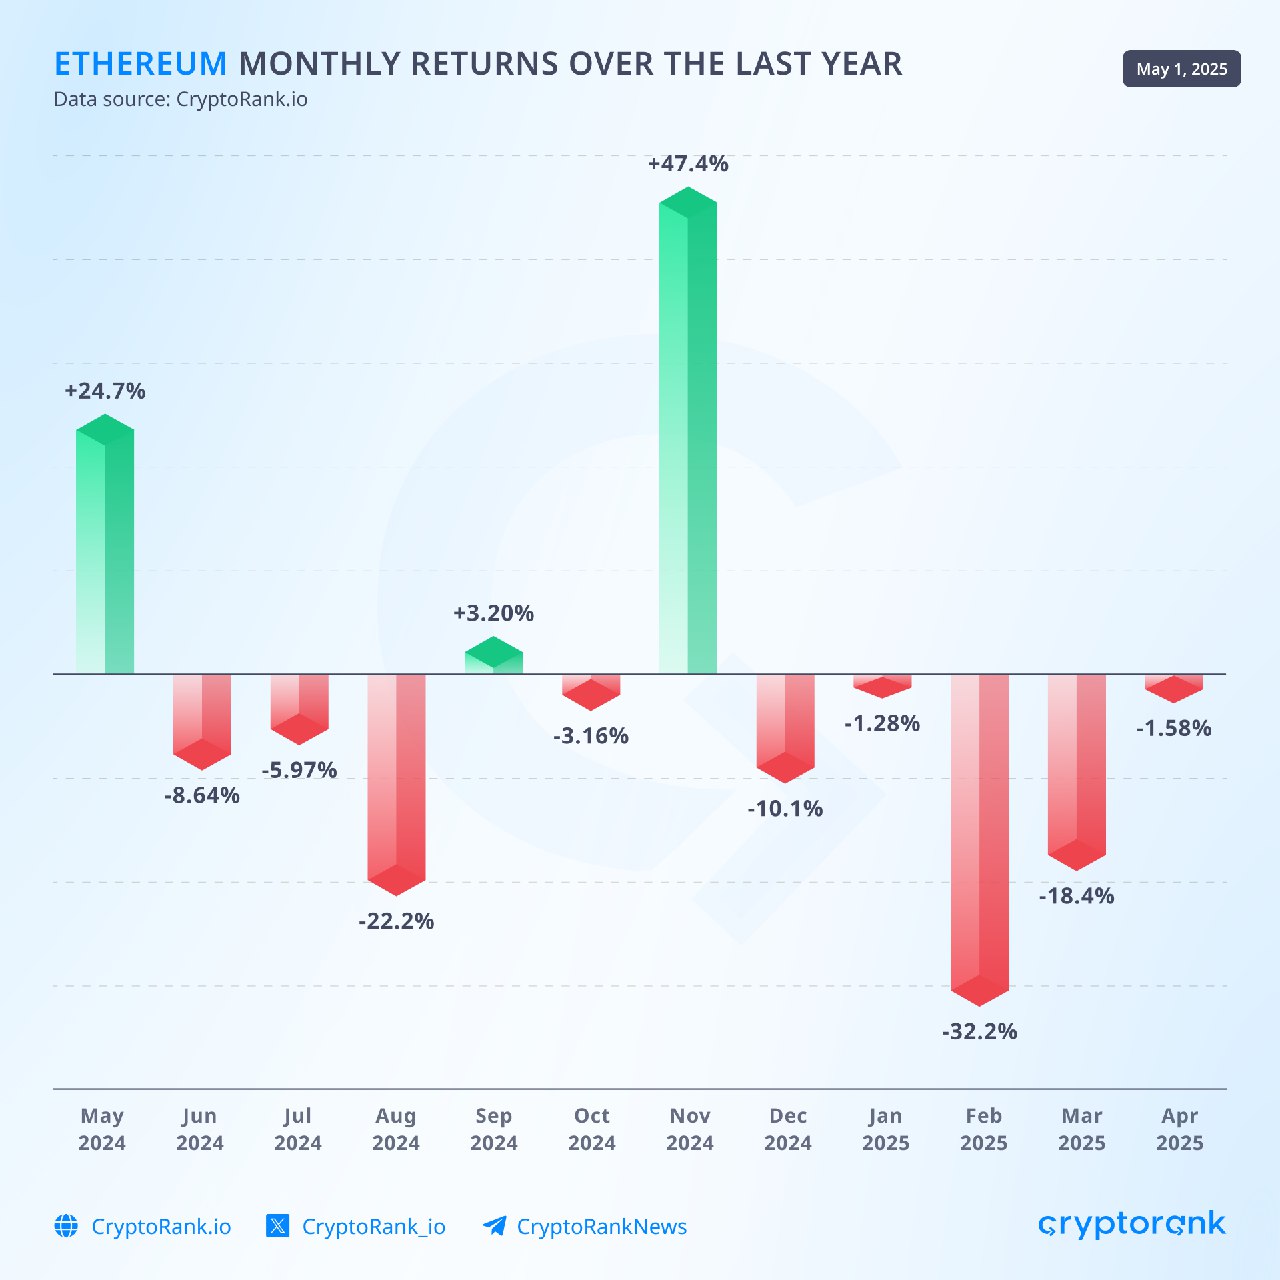
Data source: CryptoRank API
Ethereum continues to trade near its lowest levels against Bitcoin in the past six years.
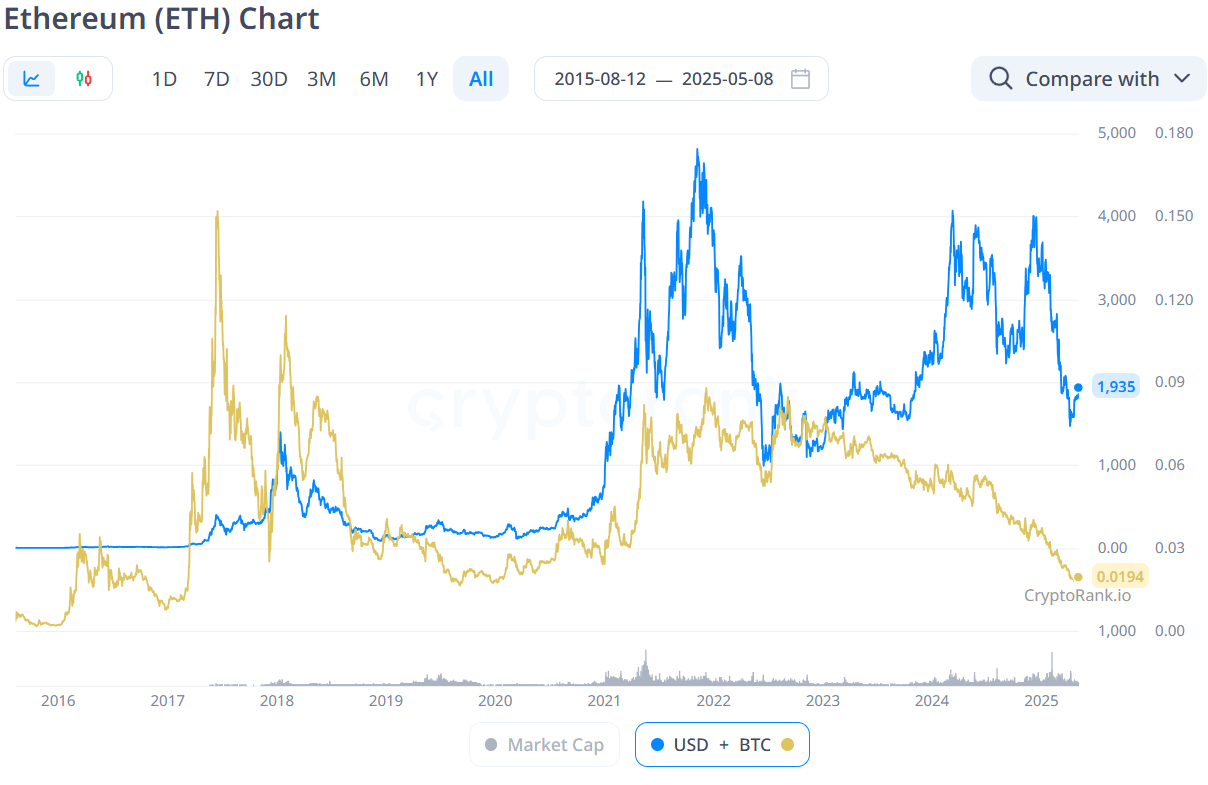
Data obtained by API
Moreover, Ethereum's dominance relative to other altcoins has also declined, reaching a 5-year low.
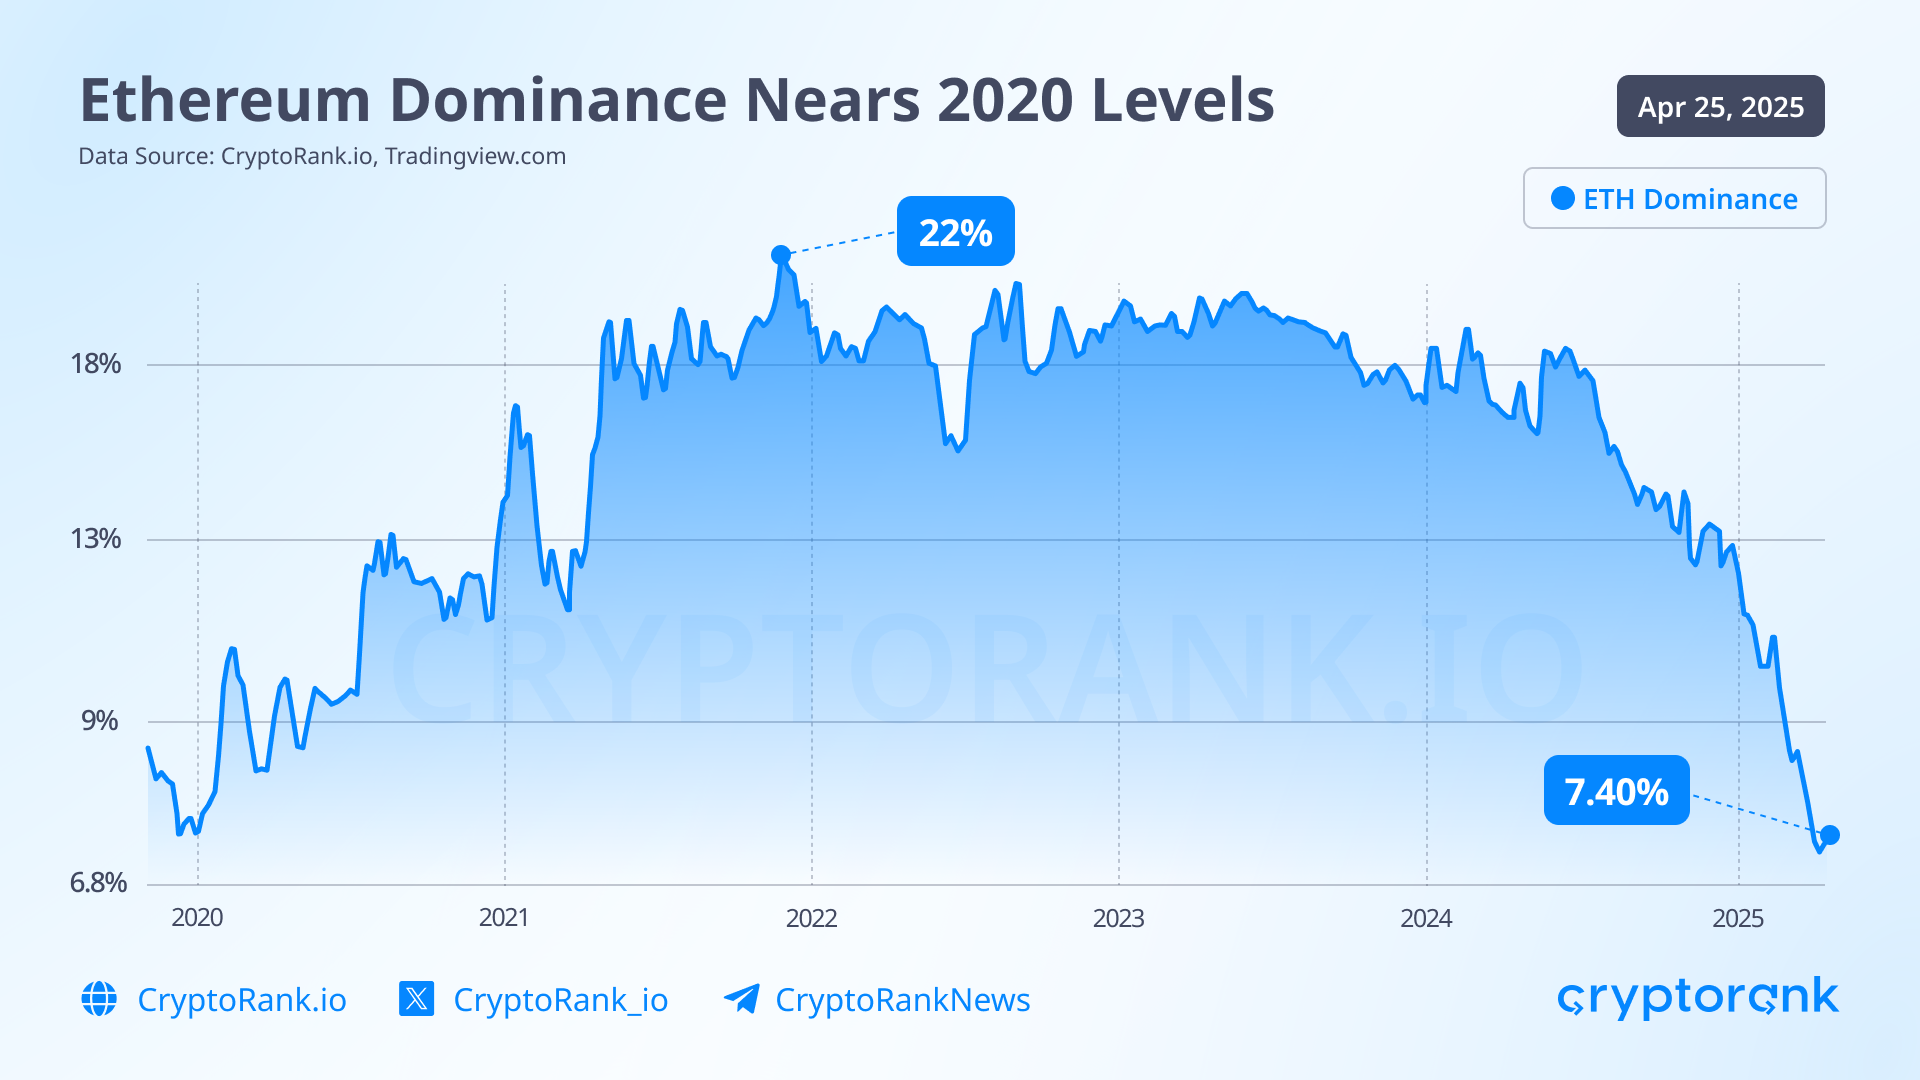
Data source: CryptoRank API
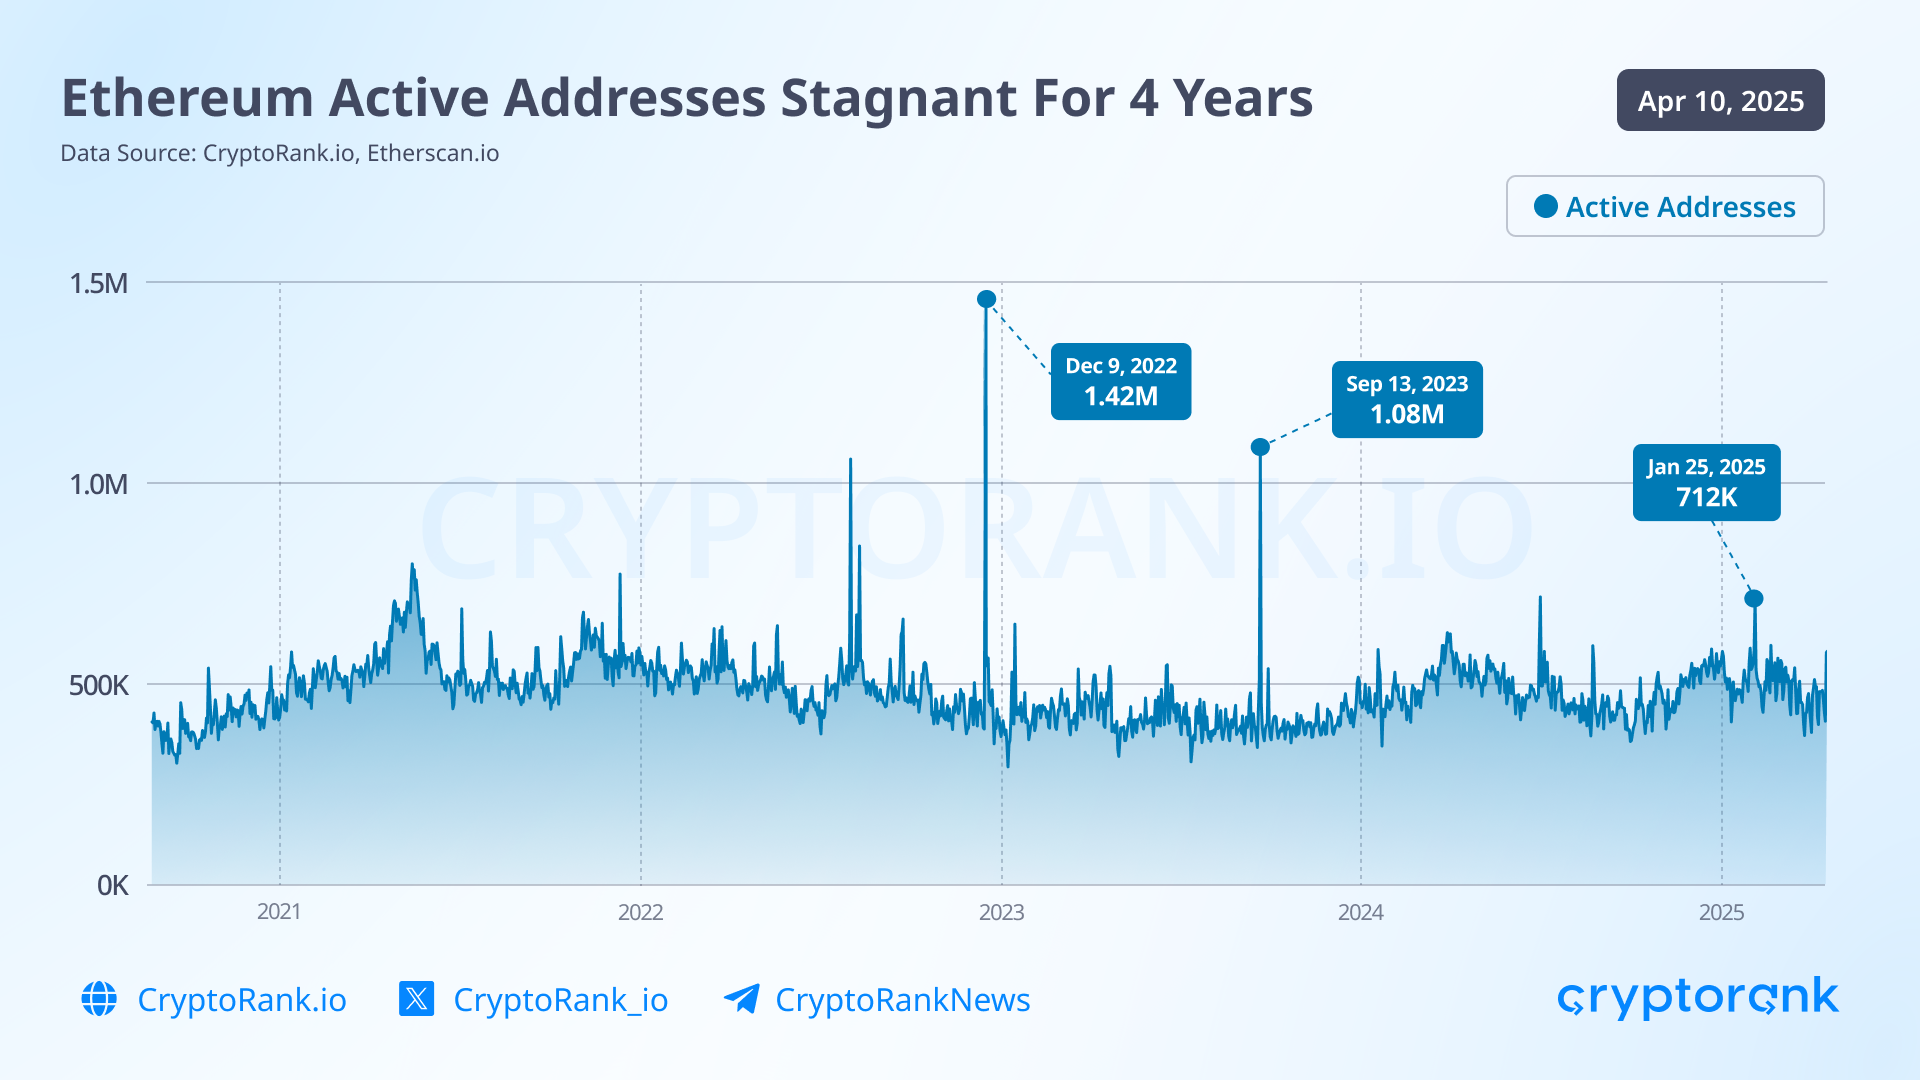
These price challenges reflect a deeper, more fundamental stagnation. Over the past 4 years, the number of active addresses on the Ethereum blockchain has remained virtually unchanged.
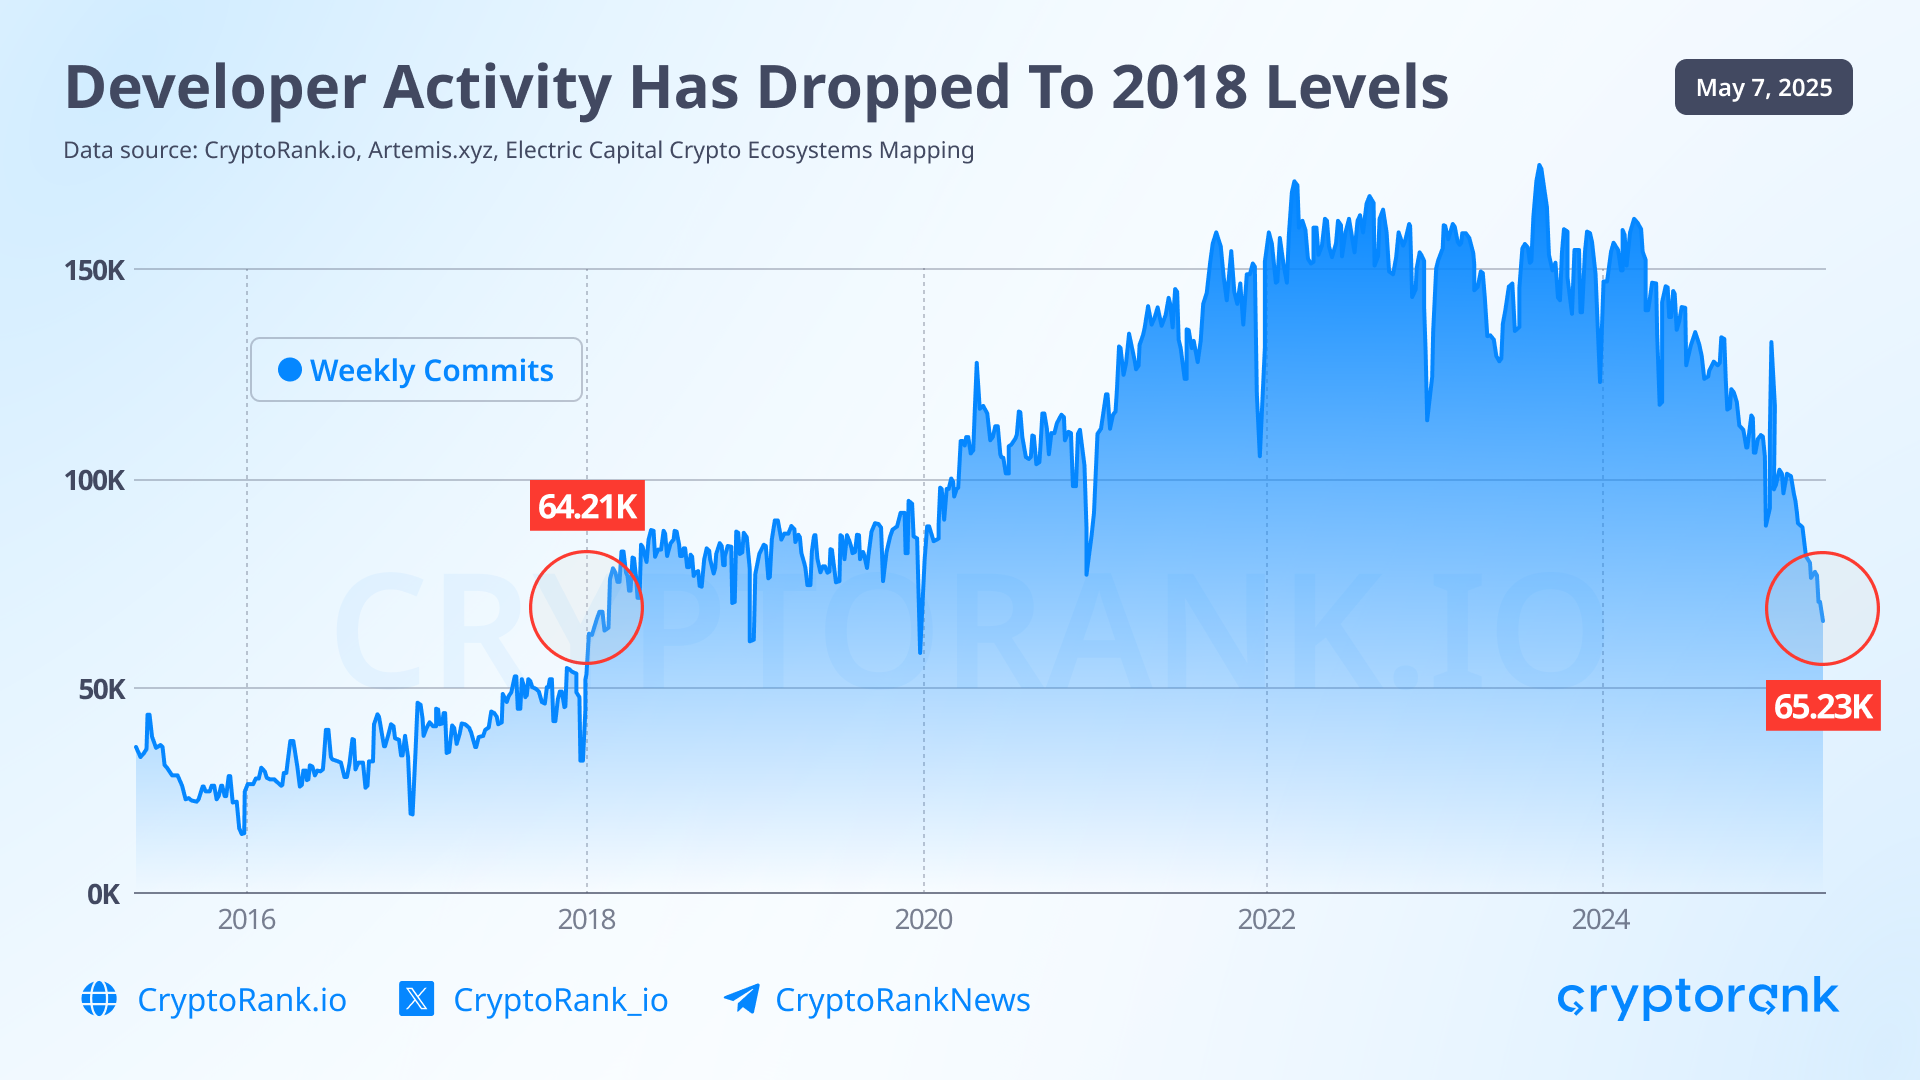
At the same time, developer activity, measured by the number of commits, has dropped to levels not seen since 2018.
The exact cause of this stagnation is hard to pinpoint. While Ethereum is clearly facing challenges, it would be wrong to say the project has stalled entirely. In fact, just days ago, Ethereum launched its most significant update since transitioning to Proof of Stake: the Pectra upgrade. We are now entering a radically new era of user interaction with Ethereum.
Beyond niche upgrades and validator quality-of-life improvements, Pectra introduces major changes aimed at making Ethereum more user-friendly. In an era dominated by Solana's rise and the memecoin frenzy, it has become painfully clear that average users dislike signing countless permissions and transactions — often without understanding what they’re approving.
Pectra addresses this issue. It allows users to:
-
Pay gas fees in any token;
-
Bundle multiple transactions without requiring user input;
-
Sponsor transactions on behalf of other entities;
-
And much more.
If you’re interested in the technical details, be sure to check out our article about Ethereum’s future update.
In the coming months, it will be interesting to see whether this upgrade shifts Ethereum’s development trajectory and eventually, its price performance.
Altcoins
Overall, April was a positive month for many altcoins in terms of price performance, as most of them continue to follow Bitcoin’s lead.
At the moment, it's difficult to identify a dominant narrative in the altcoin space. The memecoin and AI agent booms have cooled off, and no new standout trends have emerged just yet. For now, market attention is largely focused on broader macro events that are driving the price of Bitcoin and by extension, the entire crypto market.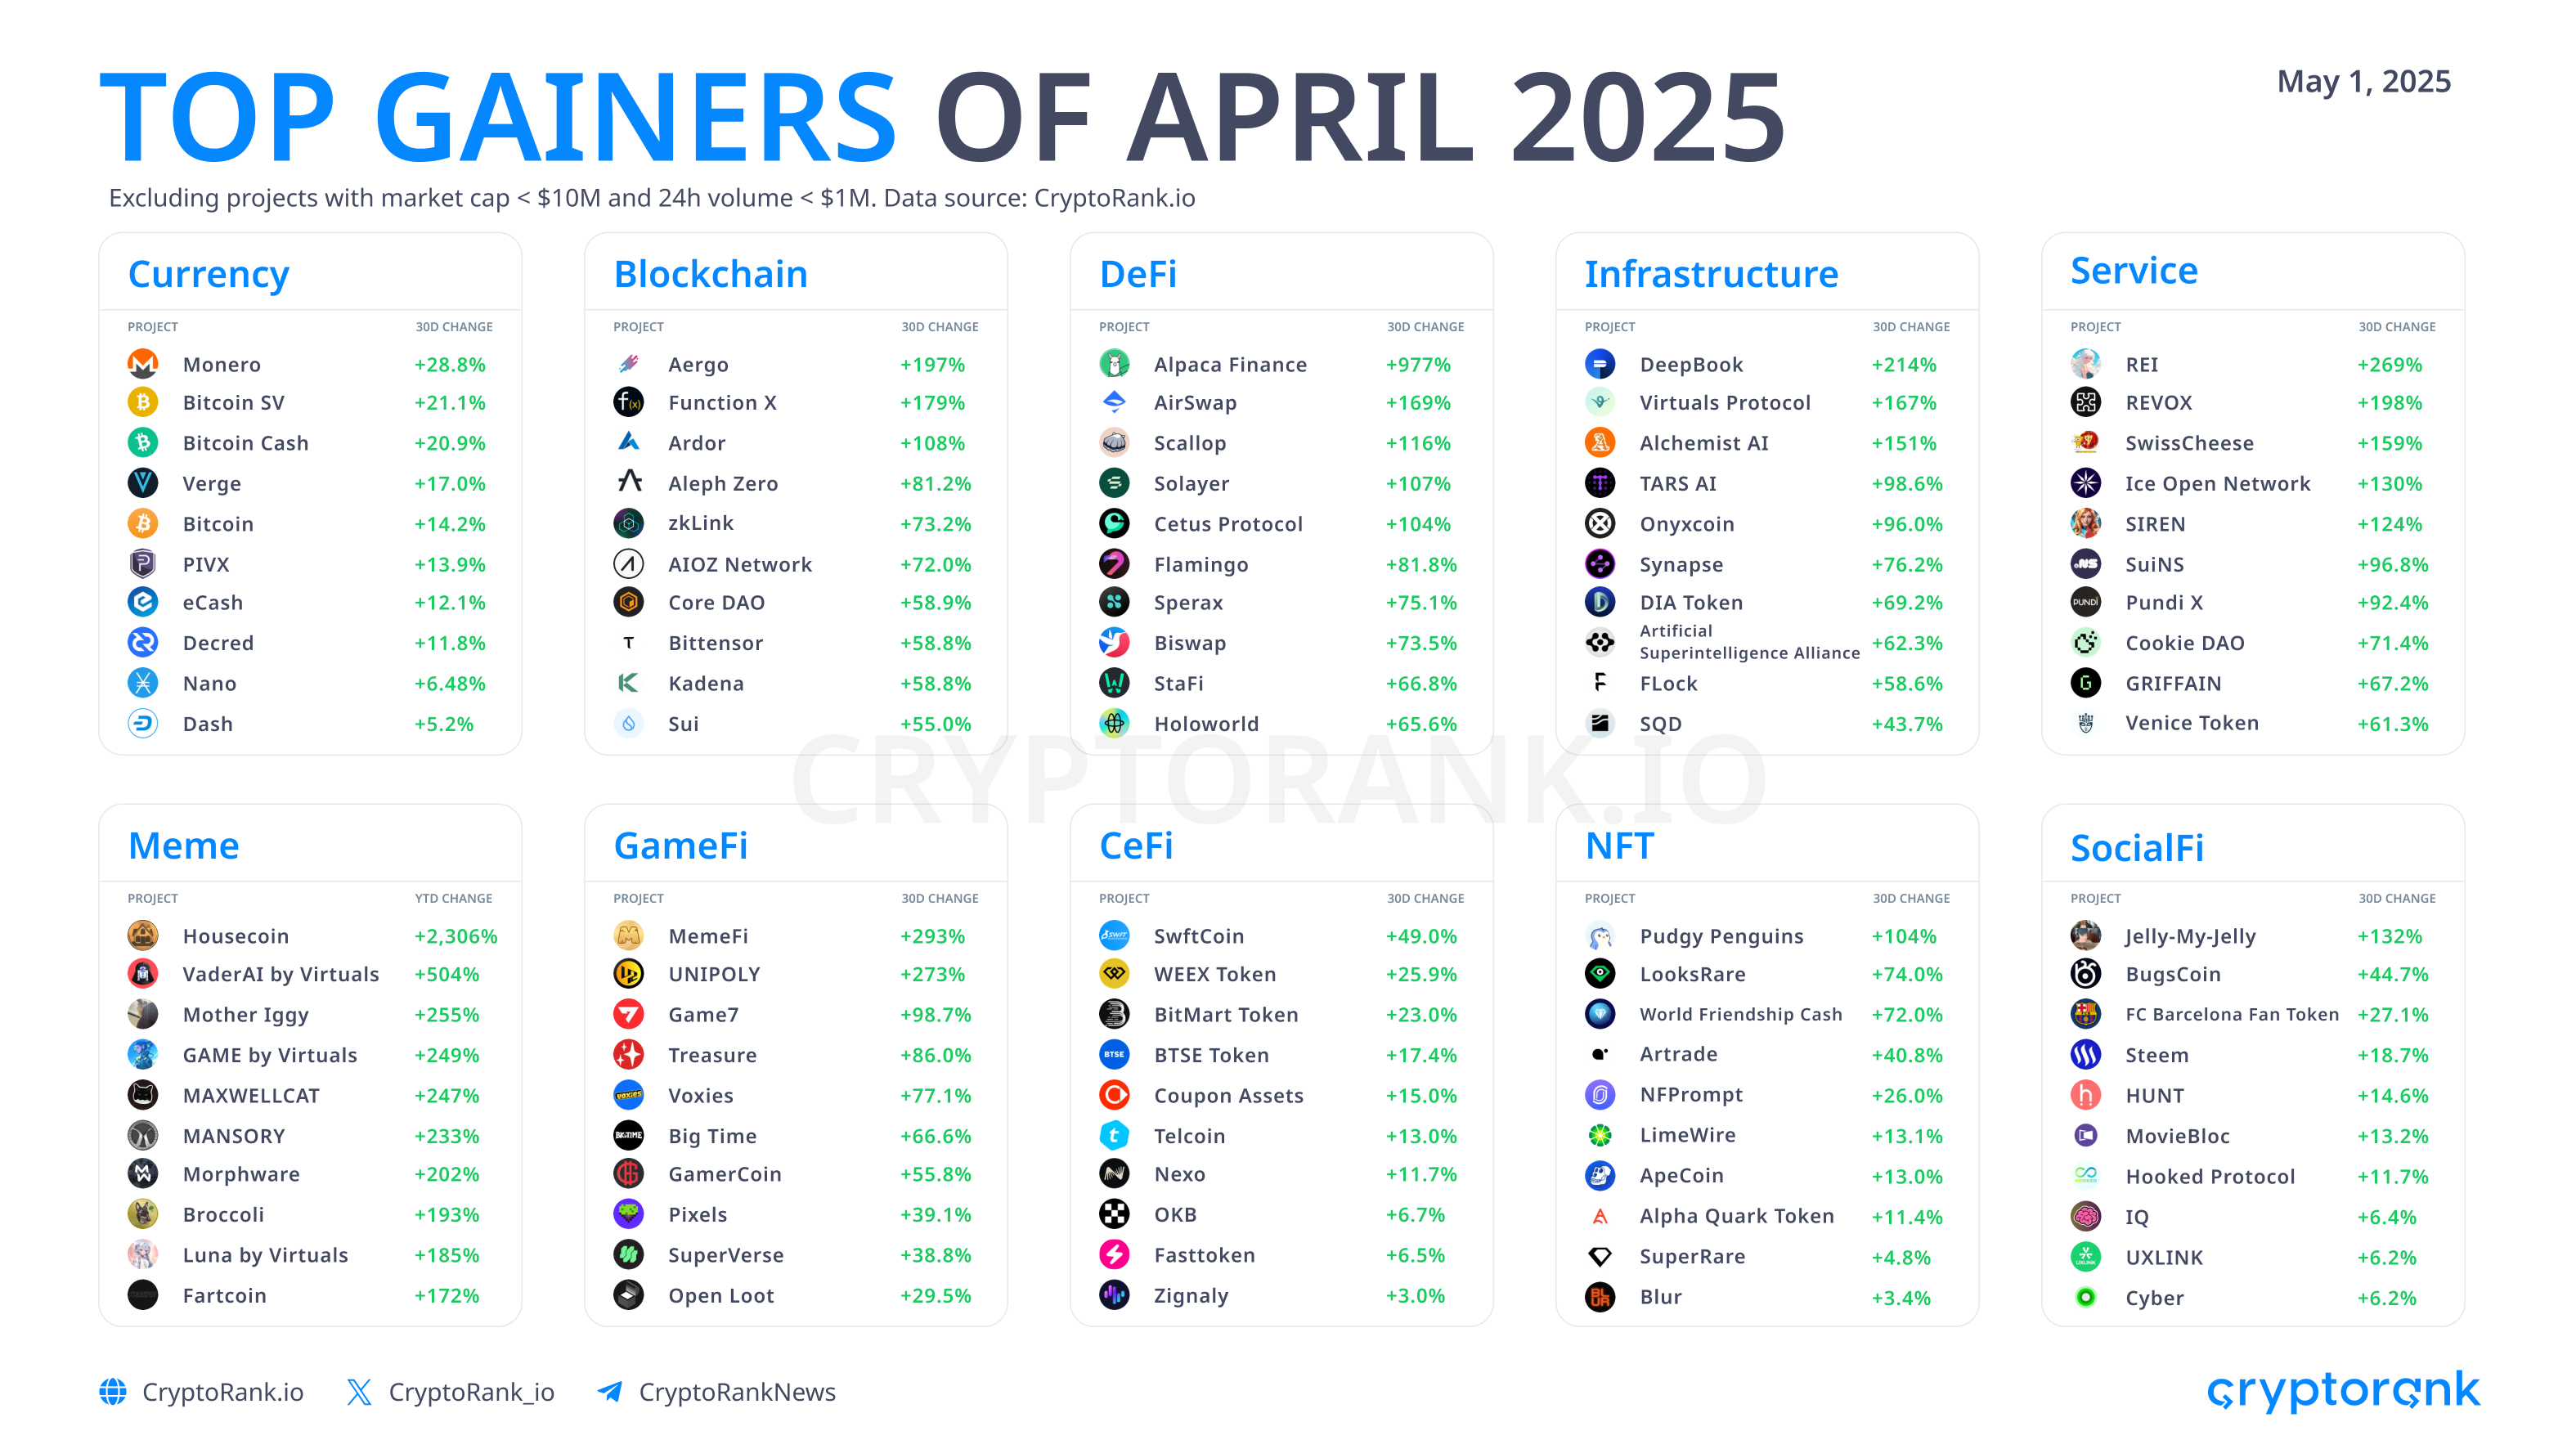
Data obtained by API
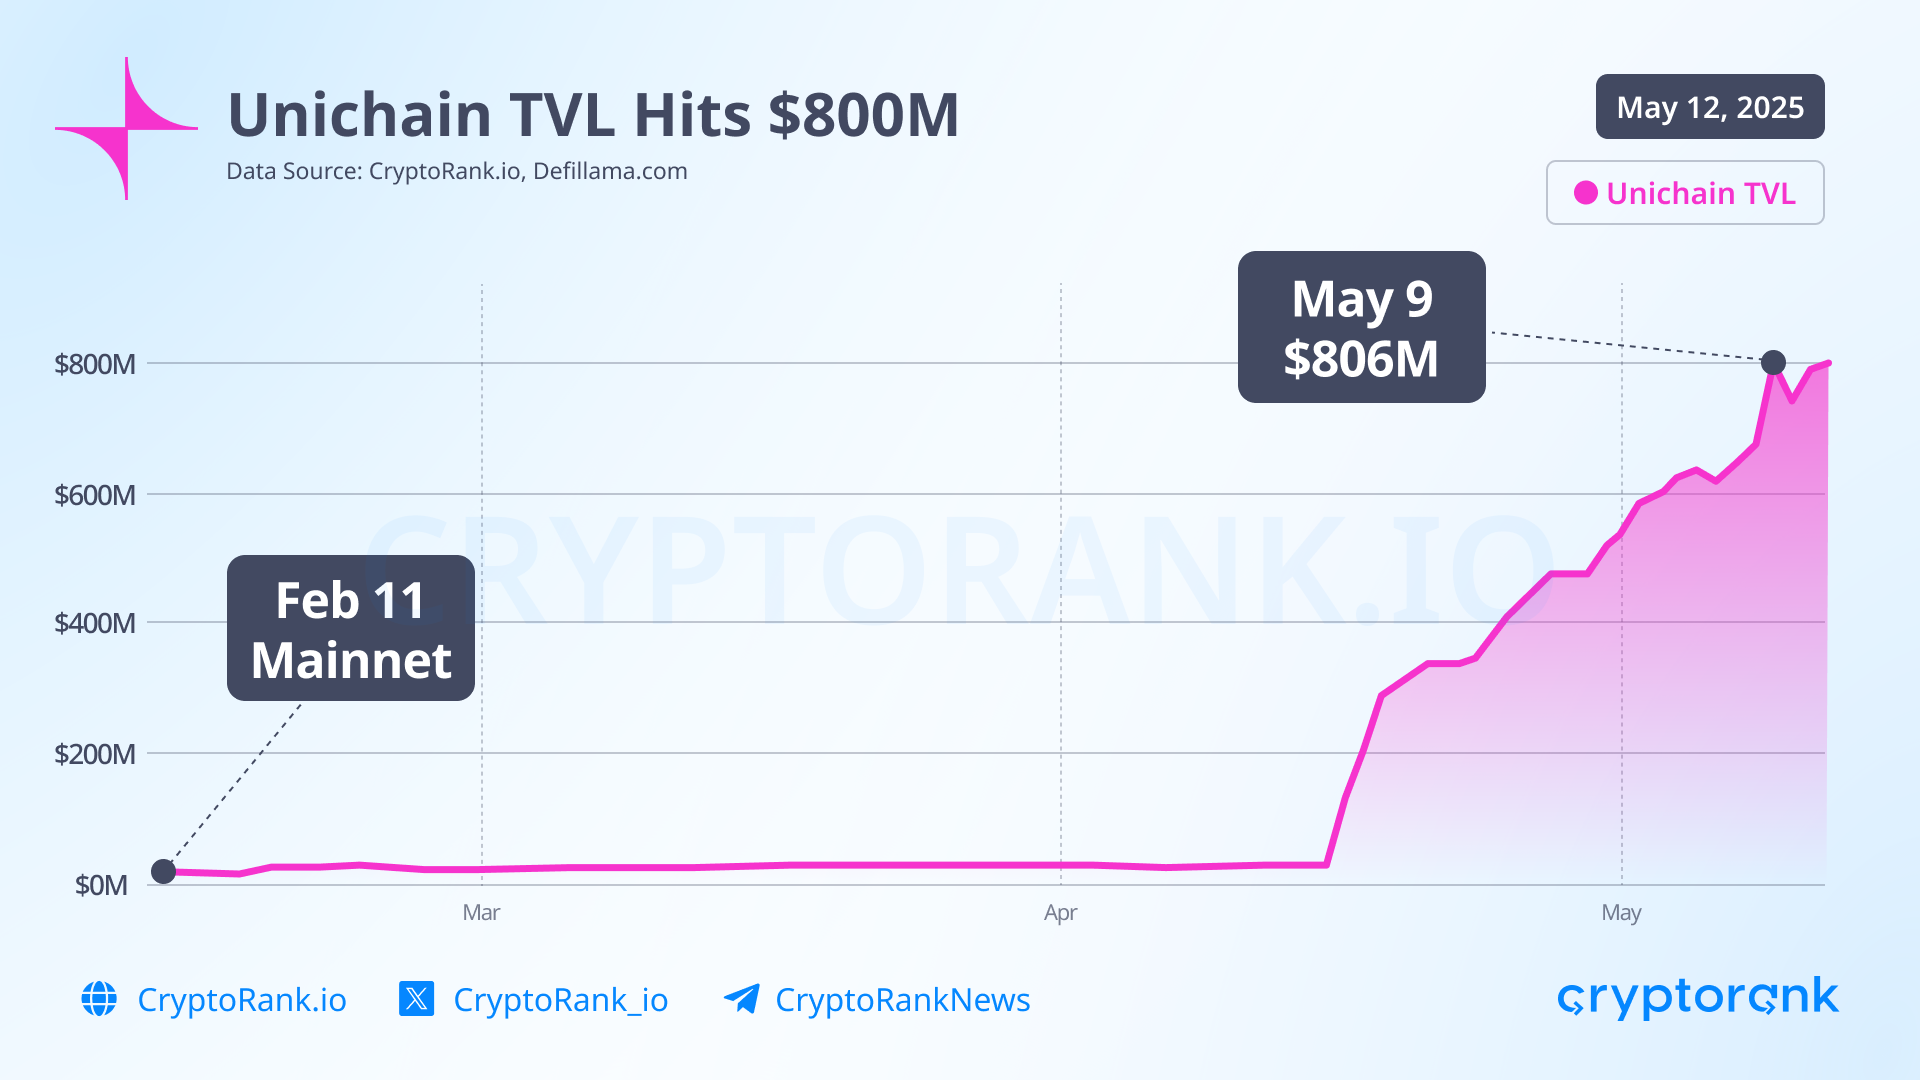
Unichain, a Layer 2 blockchain developed on the Optimism Stack by the Uniswap team, has seen explosive growth in recent weeks, driven by the launch of a new incentives campaign in mid-April.
Following the mainnet launch in early February, and prior to the start of the incentive program, the network’s TVL had reached $11M. Less than a month after the campaign began, that number skyrocketed to $800M.
The total incentives budget is $24M over six months, with $5M worth of UNI tokens to be distributed during the first three months. Rewards are being offered to users who provide liquidity to pools featuring assets like ETH, WBTC, USDC, and others. According to the DAO proposal, the initial three-month goals were to reach $750M in TVL and $11B in cumulative swap volume on Unichain. The TVL target has already been surpassed, and the volume target is close, with Unichain’s cumulative DEX volume now exceeding $8B.
The network also ranks second in net flows over the past 30 days, behind only Ethereum. However, the average daily fee on the chain is around $5K, which is relatively low compared to the millions allocated for liquidity rewards. This raises questions about the long-term sustainability and efficiency of the current economic model for UNI token holders.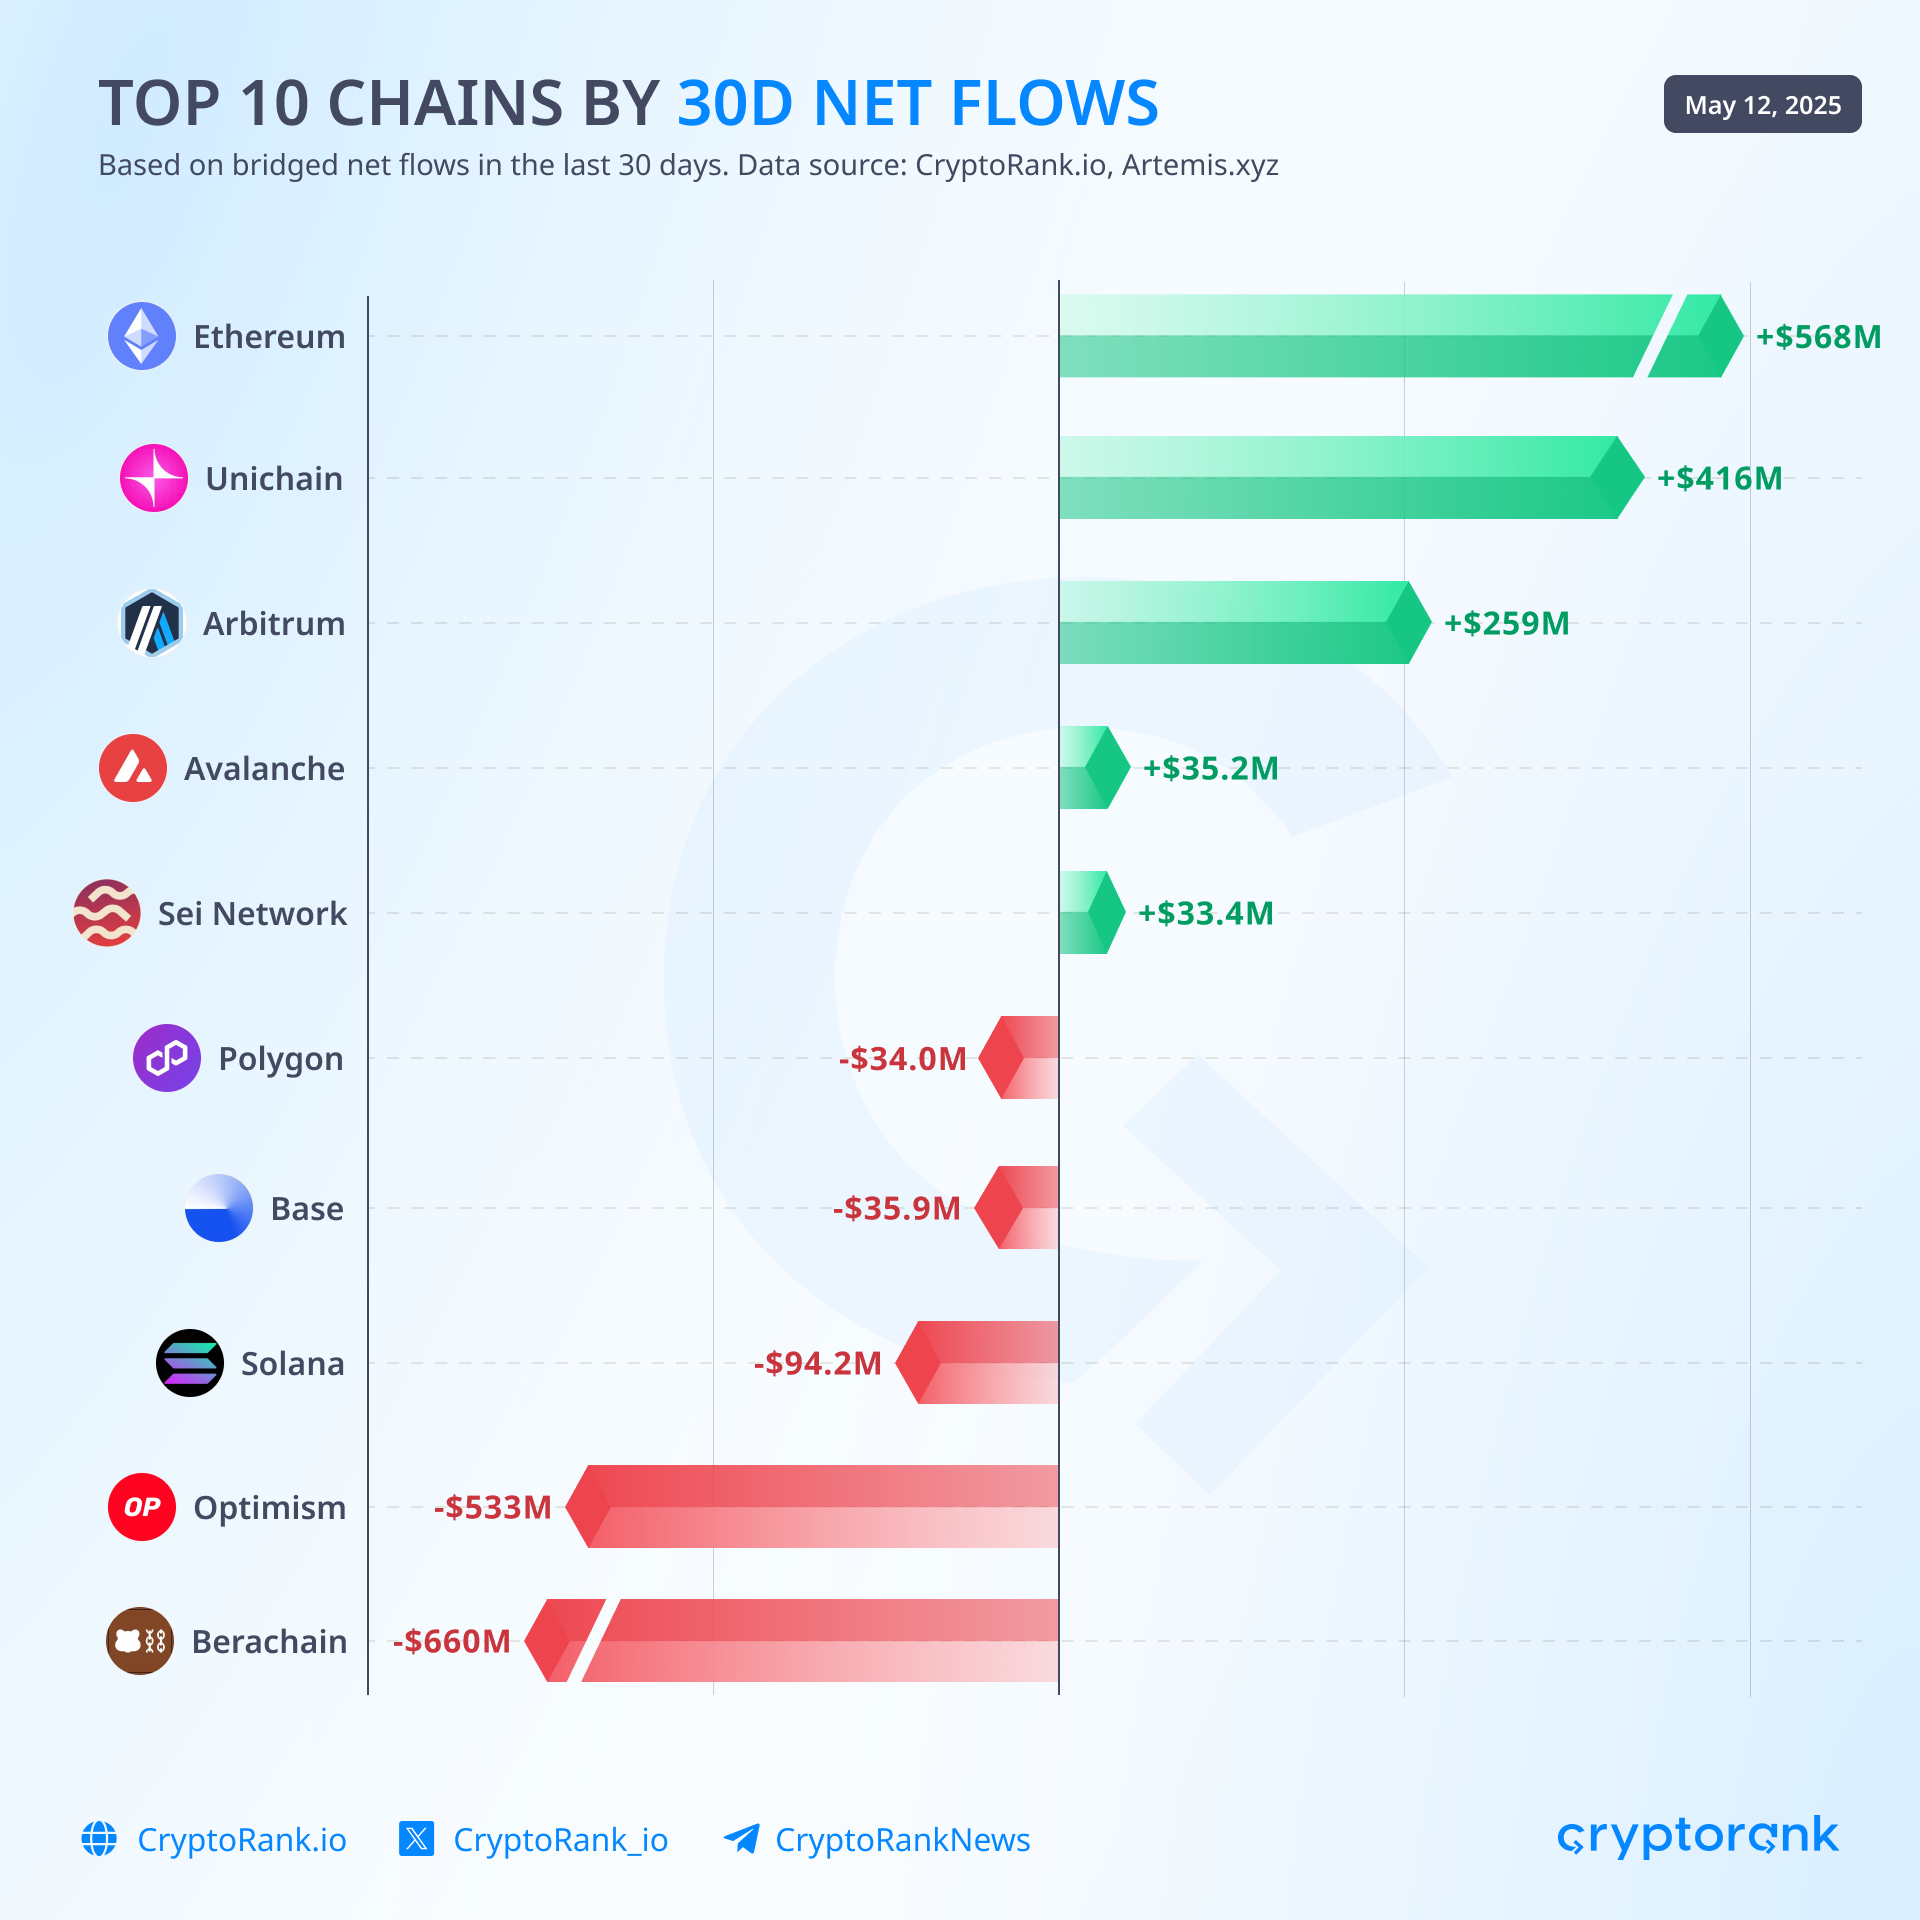
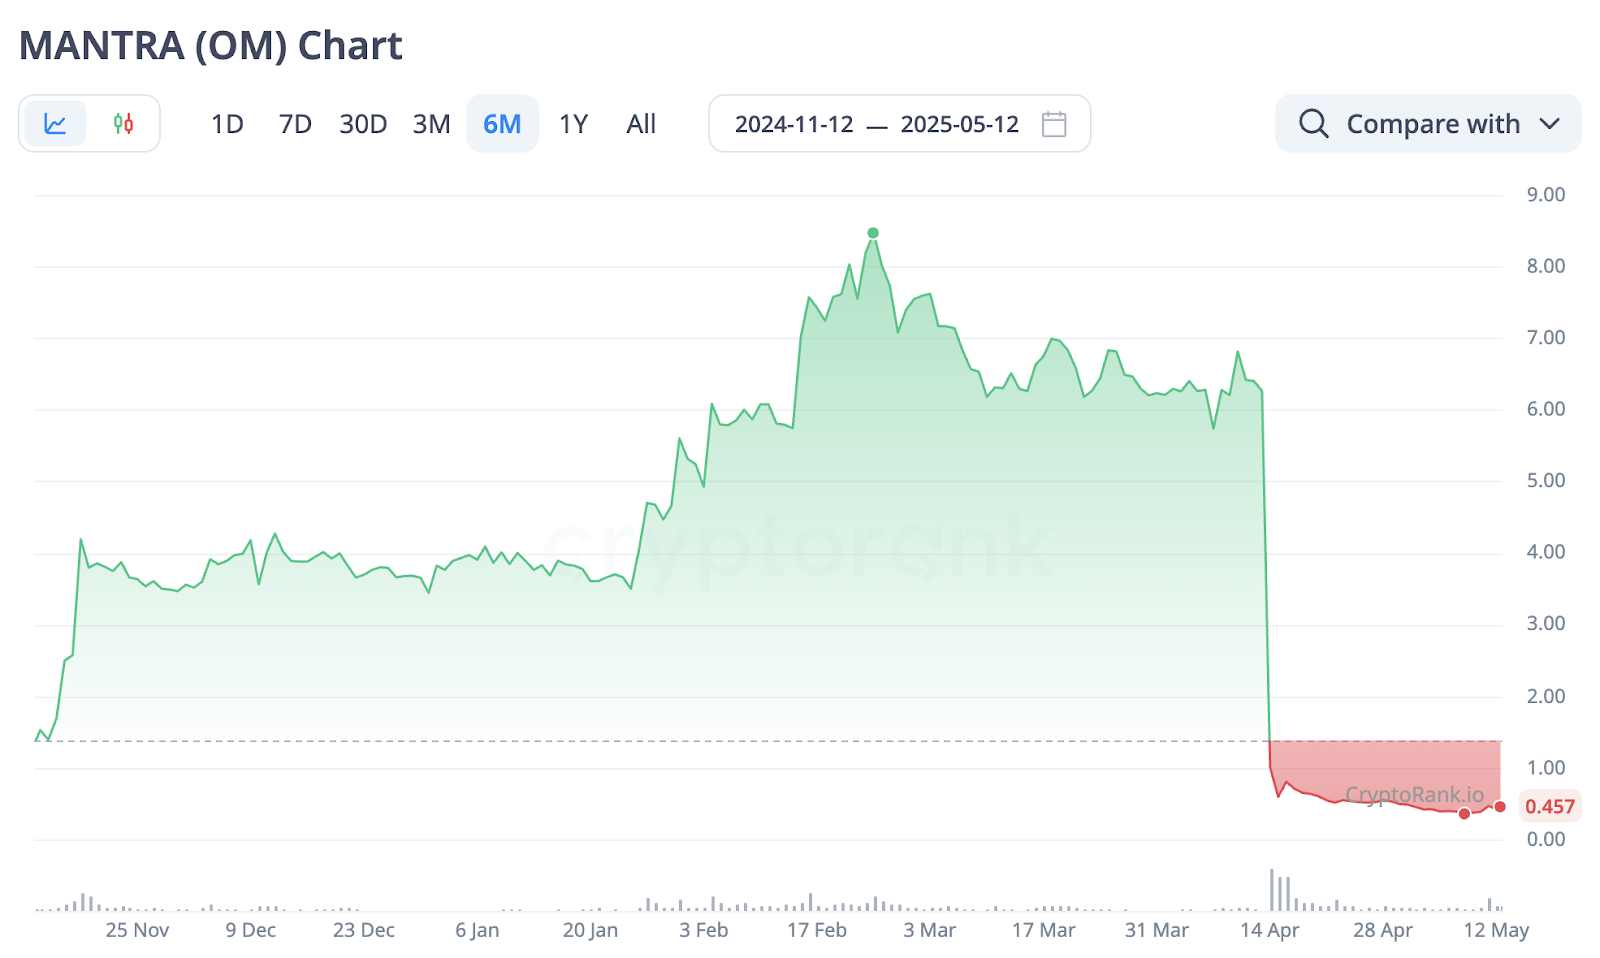
While Unichain has been successful in drawing liquidity by incentivizing DeFi users, the OM token from a project in the RWA sector suffered a dramatic loss of approximately $5.5B in market cap within just 24 hours. Although not on the scale of the Terra Luna collapse in 2022, the event served as a sharp reminder of how quickly even top-tier assets can become unstable.
The Mantra team attributed the crash to large-scale forced liquidations on centralized exchanges like Bybit and Binance, triggered under low-liquidity conditions. In response, the project’s CEO attempted to stabilize the situation by burning 150M OM tokens. A second burn of another 150M tokens is also planned, which would reduce the total OM supply from 1.82B to 1.52B.
Data source: CryptoRank API
Bitcoin continues to draw liquidity and increase its dominance in the market. This momentum is being driven by continued purchases from both nation-states and institutional players. Still, market liquidity can shift quickly and unexpectedly.
On April 28, a wallet containing 3,520 BTC, worth roughly $330M , was hacked. Following the breach, the attackers began moving the stolen funds into XMR in an effort to obfuscate the trail. This triggered a sharp rally in Monero, with its price jumping over 60% in a single day. The incident highlighted the practical use case for privacy-focused cryptos.
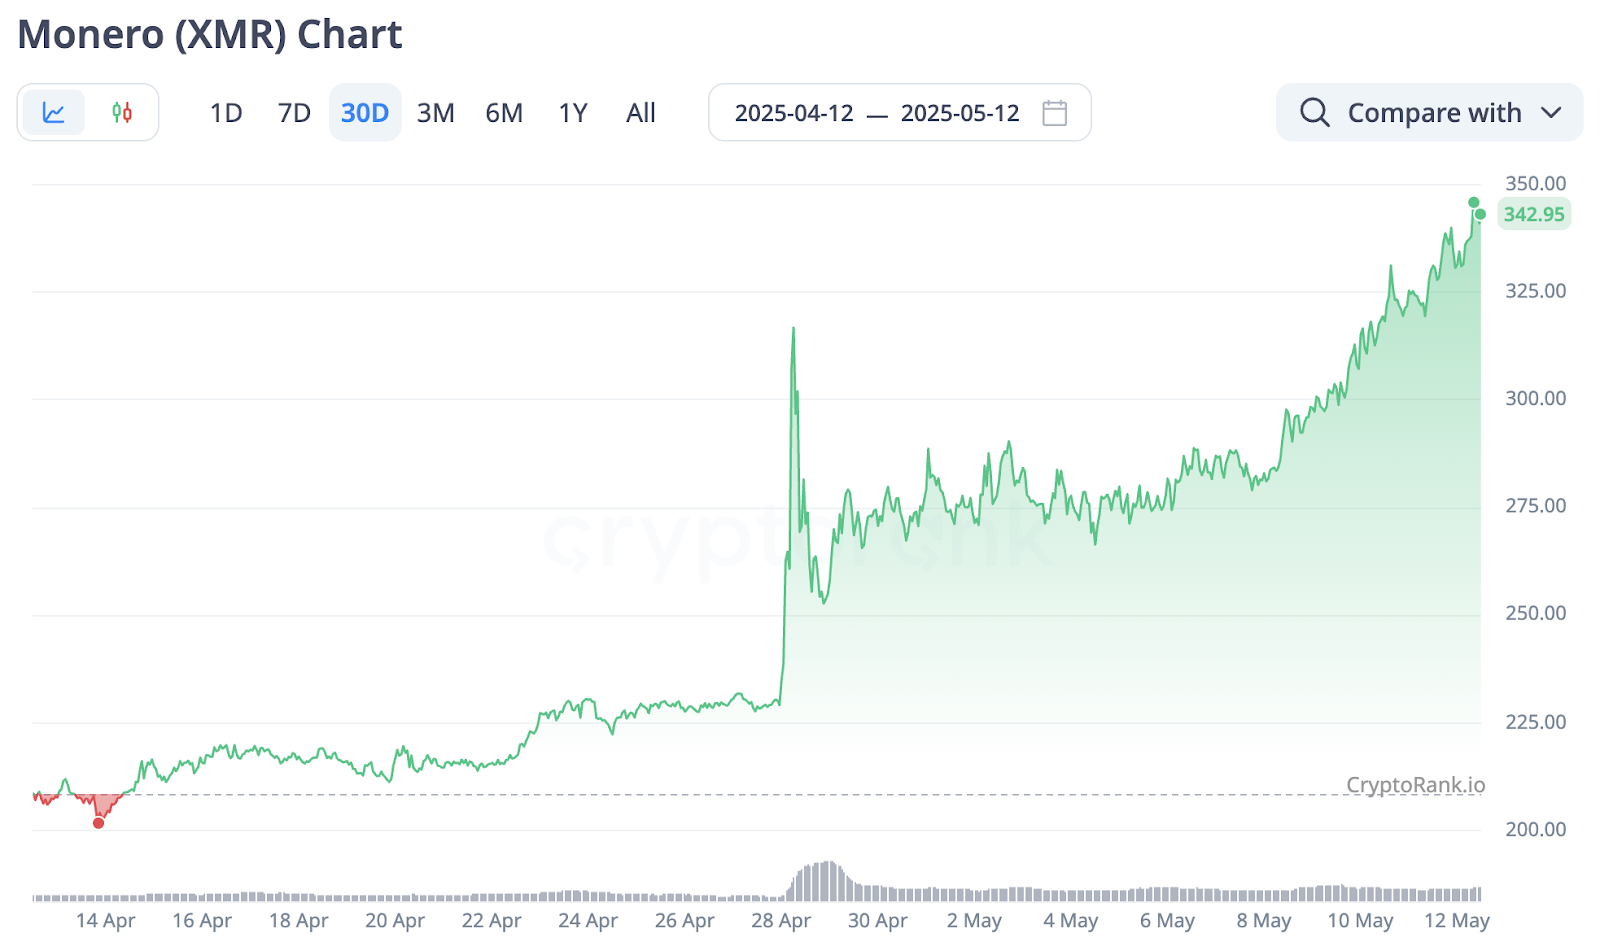
Data obtained by API
The Bottom Line
In summary, the market appears poised for further growth, bolstered by political tailwinds. Although a dominant narrative has yet to emerge, the current rotation suggests a clear division of attention between Bitcoin, Ethereum and other Layer 1s, Solana, and memecoins. Whether this landscape will shift again in the coming weeks remains an open question — and May could provide the answers.
In This Insight
Coins


Read More
Crypto Market Recap: Q1 2025
In This Insight
Coins
Share: