The Monthly Stablecoin Report: Navigating the Market’s Top Performers and Trends
Share:
Predictions Markets
See what traders are focused on

The post The Monthly Stablecoin Report: Navigating the Market’s Top Performers and Trends appeared first on Coinpedia Fintech News
Welcome to the monthly Stablecoin Report, where we delve into the dynamic landscape of stablecoins within the broader crypto market. Our analysis will comprehensively examine the stablecoin sector, leveraging the most reliable data from authoritative sources. Join us as we explore the intricate dynamics, trends, and developments shaping the world of stablecoins in this month’s report.
1. Top Stablecoins: A Simple Analysis
To do a simple analysis aimed to find the top stablecoins of the market in this month, generally, we consider three parameters: market capitalization, market dominance and trading volume.
1.1. Top Stablecoins by Market Capitalisation
| Stablecoins | Market Capitalisation |
| Tether | $97,914,593,417 |
| USDC | $28,184,111,999 |
| Dai | $5,345,820,706 |
| First Digital USD | $3,304,111,463 |
| TrueUSD | $1,256,008,250 |
| USDD | $738,038,011 |
| Frax | $648,035,200 |
Tether dominates the stablecoin market with a market cap of $97.91 billion, followed by USDC at $28.18 billion. Dai stands at $5.35 billion, with First Digital USD and True USD following suit. USDD and Frax hold smaller market shares. Tether’s significant lead underscores its prominence in the stablecoin space.
1.2. Top Stablecoins by Market Dominance
| Stablecoins | Market Dominance [in %] |
| Tether | 71.47% |
| USDC | 20.57% |
| Dai | 3.61% |
| First Digital USD | 2.42% |
| TrueUSD | 0.92% |
| USDD | 0.54% |
| Frax | 0.47% |
Tether dominates the stablecoin market with a 71.47% share, far ahead of its closest competitor, USDC, at 20.57%. Dai, First Digital USD, and TrueUSD follow with smaller percentages. USDD and Frax hold minor market shares. Tether’s dominance reflects its widespread adoption and trust within the stablecoin ecosystem.
1.3. Top Stablecoins by Trading Volume
| Stablecoins | Trading Volume |
| Tether | $31,387,217,215 |
| USDC | $3,324,659,847 |
| Dai | $112,944,329 |
| First Digital USD | $3,288,626,553 |
| TrueUSD | $48,943,945 |
| USDD | $9,044,641 |
| Frax | $7,149,932 |
Tether leads in trading volume with $31.39 billion, followed by USDC at $3.32 billion and First Digital USD at $3.29 billion. Dai, TrueUSD, USDD, and Frax have lower trading volumes. Tether’s significantly higher volume suggests its widespread use for trading and liquidity provision in the crypto market.
2. Stablecoin Price Analysis: An In-Depth Overview
Tether, USD Coin, Dai, First Digital USD, TrueUSD, USDD, and FRAX are the top seven stablecoins on the basis of market capitalisation, at the time of writing this report.
Let’s do an in-depth price analysis focusing on these seven coins.
2.1. Stablecoin One Month Change
| Stablecoins | One Month Change (in %) |
| Tether | +1.96% |
| USDC | +7.79% |
| Dai | -5.68% |
| First Digital USD | +32.71% |
| TrueUSD | -22.11% |
| USDD | +2.28% |
| Frax | -0.22% |
First Digital USD experienced the highest one-month change at +32.71%, followed by USDC at +7.79%. Tether saw a modest increase of +1.96%, while TrueUSD suffered the most significant decline at -22.11%. Dai and Frax also experienced decreases, indicating fluctuations in stability and market demand among the top seven stablecoins.
2.2. Stablecoin One Month % Off Peg
| Stablecoins | 1M % Off Peg |
| Tether | +0.40% |
| USDC | +0.50% |
| Dai | +0.30% |
| First Digital USD | +1.20% |
| TrueUSD | -2.71% |
| USDD | -0.82% |
| Frax | +0.50% |
Among the top seven stablecoins, TrueUSD experienced the highest deviation from its peg at -2.71%, while First Digital USD, USDC, Frax, Tether, and Dai were slightly above the pegs. USDD deviated negatively, though less significantly. The deviations indicate market dynamics influencing stablecoin prices relative to their intended pegs.
3. Stablecoins in Blockchains: A Detailed Overview
| Blockchains | Stablecoins Market Cap |
| Ethereum | $72.143B |
| Tron | $51.487B |
| BSC | $4.658B |
| Arbitrum | $2.287B |
| Solana | $2.228B |
| Polygon | $1.474B |
| Avalanche | $1.133B |
Ethereum dominates stablecoin market cap among blockchains with $72.143 billion, followed by Tron at $51.487 billion. Binance Smart Chain, Arbitrum, Solana, Polygon, and Avalanche hold smaller shares. Ethereum’s significant lead highlights its role as a primary platform for stablecoin issuance and transactions within the crypto ecosystem.
3.1. USDT Dominance in Blockchains
| Blockchains | USDT Dominance |
| Tron | 50.72% |
| Ethereum | 40.28% |
| BSC | 3.66% |
| Arbitrum | 1.76% |
| Solana | 0.80% |
| Others | 2.78% |
Tron leads in USDT dominance among blockchains with 50.72%, followed by Ethereum at 40.28%. Binance Smart Chain (BSC), Arbitrum, and Solana have smaller shares. Tron’s significant lead in USDT dominance reflets its popularity as a platform for USDT transactions, while Ethereum maintains a notable presence in the stablecoin market.
3.2. USD Coin Dominance in Blockchains
| Blockchains | USD Coin Dominance |
| Ethereum | 82.16% |
| Solana | 5.25% |
| Polygon | 1.97% |
| BSC | 1.64% |
| Arbitrum | 1.41% |
| Others | 7.57% |
Ethereum dominates USD Coin usage among blockchains with 82.16%, highlighting its stronghold in facilitating USDC transactions. Solana follows with 5.25%, while Polygon, Binance Smart Chain, and Arbitrum hold smaller shares. Ethereum’s dominance underscores its significance in the ecosystem for USDC- based transactions and liquidity provision.
3.3. Dai Dominance in Blockchains
| Blockchains | Dai Dominance |
| Ethereum | 91.12% |
| Polygon | 2.74% |
| Arbitrum | 1.61% |
| Gnosis | 1.57% |
| Others | 2.96% |
Ethereum overwhelmingly dominates Dai usage among blockchains with 91.12%, underscoring its pivotal role as the primary platform for Dai transactions and liquidity, Polygon follows distantly with 2.74%, while Arbitrum and Gnosis have smaller shares. Ethereum’s dominance reflects its robust infrastructure supporting Dai’s decentralised stablecoin ecosystem.
3.4. First Digital USD Dominance in Blockchains
| Blockchains | First Digital USD Dominance |
| Ethereum | 95.07% |
| BSC | 4.93% |
Ethereum overwhelmingly dominates First Digital USD usage among blockchains with 95.07%, highlighting its central role as the primary platform for transactions involving this stablecoin. Binance Smart Chain follows with a smaller share of 4.93%. Etheruem’s dominance underscores its robust infrastructure supporting First Digital USD transactions and liquidity.
3.5. TrueUSD Dominance in Blockchains
| Blockchains | TrueUSD Dominance |
| Tron | 68.77% |
| Ethereum | 30.79% |
| Others | 0.44% |
Among blockchains, Tron dominates TrueUSD usage with 68.77%, while Ethereum follows with 30.79%. Tron’s significant lead underscores its role as the primary platform for TrueUSD transactions and liquidity. Ethereum, although having a smaller share, still maintains a notable presence in facilitating TrueUSD transactions within its ecosystem.
3.6. USDD Dominance in Blockchains
| Blockchains | USDD Dominance |
| Tron | 99.26% |
| Ethereum | 0.62% |
| Others | 0.12% |
Tron overwhelmingly dominates USDD usage among blockchains with 99.26%, illustrating its central role in facilitating transactions involving this stablecoin. Ethereum trails significantly with only 0.62% dominance. Tron’s dominance reflects its robust infrastructure supporting USDD transactions, while Ethereum’s smaller indicates lesser utilisation for USDD transactions within its ecosystem.
3.7. Frax Dominance in Blockchains
| Blockchains | Frax Dominance |
| Ethereum | 87.11% |
| Arbitrum | 6.14% |
| Harmony | 1.25% |
| BSC | 1.01% |
| Others | 4.49% |
Ethereum dominates Frax usage among blockchains with 87.11%, highlighting its central role in facilitating transactions involving this stablecoin. Arbitrum follows with 6.14%, while Harmony and Binance Smart Chain have smaller shares. Ethereum’s dominance underscores its robust infrastructure supporting Frax transactions and liquidity within the ecosystem.
4. Stablecoins in Exchanges: A Simple Analysis
Let’s examine the level of engagement of stablecoins on cryptocurrency exchanges, by focusing on the top three centralised and decentralised exchanges, exploring whether stablecoins feature prominently within the top five trading pairs on each platform.
4.1. Stablecoins in Centralised Exchanges
Binance, Coinbase Exchange and OKK are the top three centralised exchanges, on the basis of monthly visits, as they have attracted 73.5, 42.1M and 29M, monthly visits, respectively. Let’s analyse these three centralised exchanges.
4.1.1. Stablecoin Active Trading Pairs in Binance
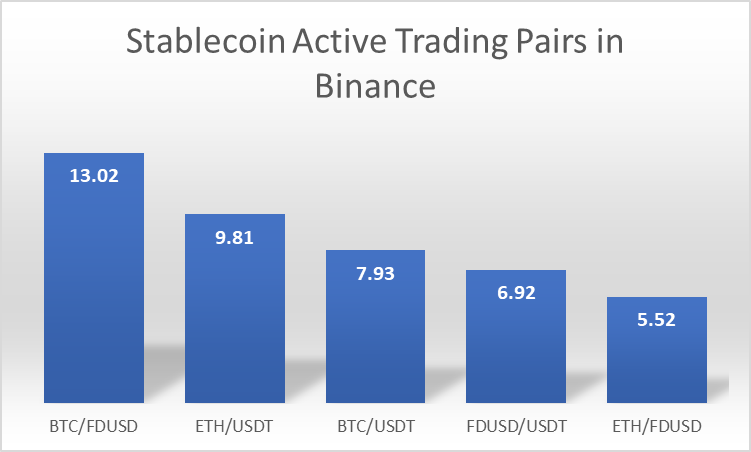
| Binance Top Trading Pairs | Volume % |
| BTC/FDUSD | 13.02% |
| ETH/USDT | 9.81% |
| BTC/USDT | 7.93% |
| FDUSD/USDT | 6.92% |
| ETH/FDUSD | 5.52% |
In Binance’s active trading pairs, BTC/FDUSD leads with 13.02%, followed by ETH/USDT at 9.81% and BTC/USDT at 7.93%. FDUSD/USDT and ETH/FDUSD also contribute, albeit to a lesser extent. These pairs indicate significant trading activity involving Bitcoin, Etherum and stablecoins like FDUSD and USDT on Binance’s platform.
4.1.2. Stabelcoin Active Trading Pairs in Coinbase Exchange
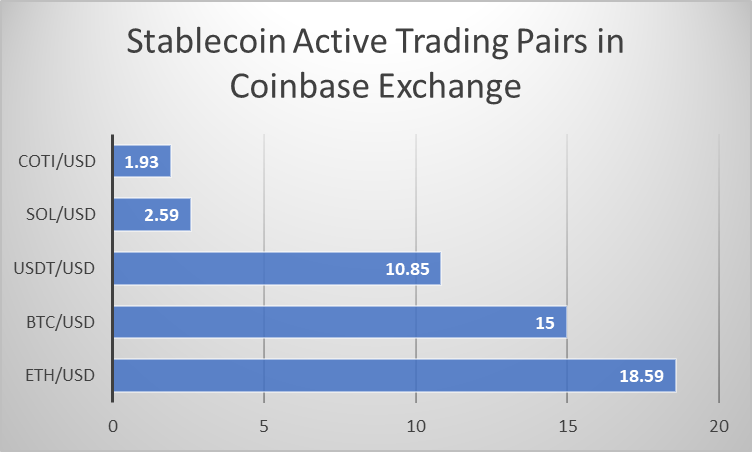
| Coinbase Top Trading Pairs | Volume % |
| ETH/USD | 18.59% |
| BTC/USD | 15.0% |
| USDT/USD | 10.85% |
| SOL/USD | 2.59% |
| COTI/USD | 1.93% |
Coinbase’s active trading pairs are dominated by fiat-to-cryptocurrency pairs, with ETH/USD leading at 18.59%, followed by BTC/USD at 15.0% and USDT/USD at 10.85%. These pairs reflect significant trading activity between cryptocurrencies and traditional fiat currencies, particularly Etherum and Bitcoin against the US dollar, on Coinbase’s platform.
4.1.3. Stablecoin Active Trading Pairs in OKK
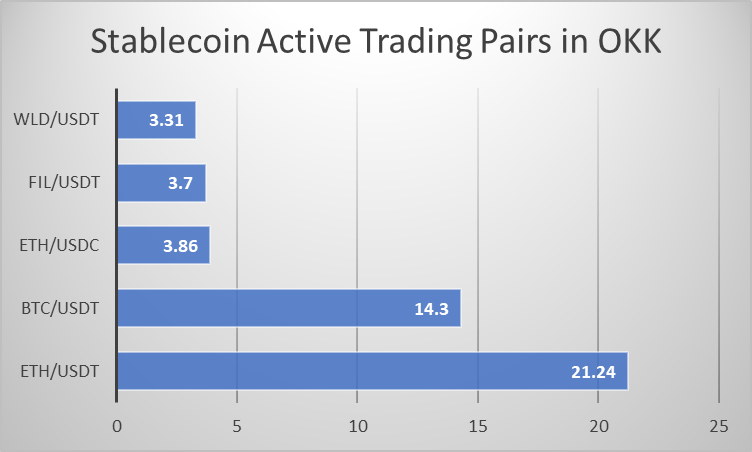
| OKK Top Trading Pairs | Volume % |
| ETH/USDT | 21.24% |
| BTC/USDT | 14.3% |
| ETH/USDC | 3.86% |
| FIL/USDT | 3.7% |
| WLD/USDT | 3.31% |
On OKK exchange, stablecoin trading pairs are prominent, with ETH/USDT leading at 21.24% and BTC/USDT following at 14.3%. Other pairs like ETH/USDC, FIL/USDT, and WLD/USDT also contribute, albeit to a lesser extent. This reflects a significant preference for trading Ethereum and Bitcoin against stablecoins like USDT, USDC on OKK.
4.2. Stablecoins in Decentralised Exchanges
Jupiter, Uniswap V3 (Ethereum), and Uniswap V3 (Arbitrum One) are the three top decentralised exchanges, on the basis of monthly visits, as they have attracted 9706834, 9415033, 9415033 monthly visits, respectively. Let’s analyse these three decentralised exchanges.
4.2.1. Stablecoin Active Trading Pairs in Jupiter

| Jupiter Top Trading Pairs | Volume |
| USDC/SOL | $65,612,311 |
| JITOSOL/SOL | $15,168,395 |
| USDC/USDT | $14,913,900 |
| USDC/JUP | $11,815,722 |
| JUP/SOL | $9,401,574 |
Jupiter’s active trading pairs feature USDC heavily, with USDC/SOL leading in volume at $65,612,311. Other pairs like USDC/USDT and USDC/JUP follow, indicating a significant preference for trading USDC against SOL and other cryptocurrencies on the Jupiter exchange, reflecting its importance as a stablecoin for trading on this platform.
4.2.2. Stablecoin Active Trading Pairs in Uniswap V3 (Ethereum)
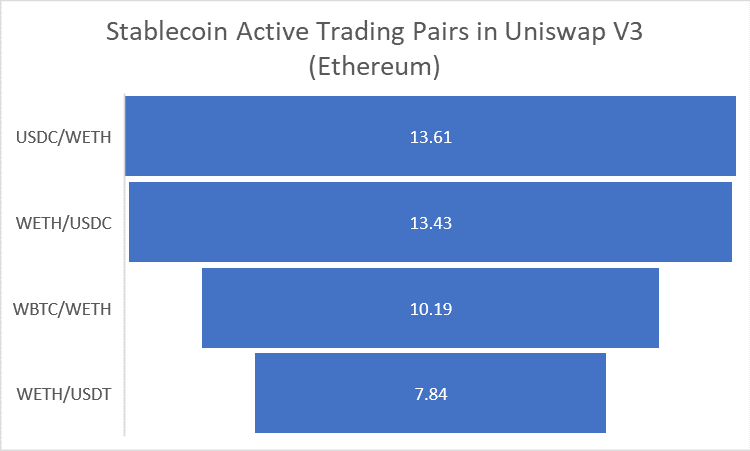
| Uniswap V3 (Ethereum) Top Trading Pairs | Volume % |
| USDC/WETH | 13.61% |
| WETH/USDC | 13.43% |
| WBTC/WETH | 10.19% |
| WETH/USDT | 7.84% |
In Uniswap V3 (Ethereum), stablecoin trading pairs are prevalent, with USDC/WETH and WETH/USDC leading at 13.61% and 13.43% respectively. WBTC/WETH follows at 10.19%, indicating significant trading activity involving Wrapped Bitcoin and Wrapped Ether. These pairs reflect users’ preference for trading between stablecoins and cryptocurrencies on Uniswap V3 (Ethereum).
4.2.3. Stablecoin Active Trading Pairs in Uniswap V3 (Arbitrum One)
| Uniswap V3 (Arbitrum One) Top Trading Pairs | Volume % |
| USDC/WETH | 27.42% |
| WETH/USDV.E | 13.43% |
| WBTC/WETH | 12.16% |
| WETH/USDT | 11.01% |
| ARB/USDC.E | 9.92% |
In Uniswap V3 (Arbitrum One), stabelcoin trading pairs dominate, with USDC/WETH leading at 27.42%. Other pairs like WETH/USDV.E and WBTC/WETH follow. These pairs reflect user’s preference for trading with stablecoins and enhancing liquidity on Arbitrum One’s decentralised exchange platform.
The in-depth analysis report covers every development that a stablecoin enthusiast should know about the stablecoin market. The data collected from the most trustworthy source ensures the quality of the report. The report clearly indicates that the stablecoin market has been consistently growing and some of the top players like Tether have performed really well. And, the report also gives hints about some unexpected trends.
In This News
Coins

$ 63.83K
-0.49%
$ 1.80K
+0.08%
$ 0.331
+0.36%
$ 0.99931
+0.03%
$ 109.58
+0.54%


Predictions Markets
See what traders are focused on
Share:
In This News
Coins
$ 63.83K
-0.49%$ 1.80K
+0.08%$ 0.331
+0.36%$ 0.99931
+0.03%$ 109.58
+0.54%Predictions Markets
See what traders are focused on
Share:
Read More

IMF paper warns dollar stablecoins can trigger coordinated currency runs