Top 100 Coins
Trending Cryptos
Performance
Recently Listed
Gainers
All Categories
All Time High
Blockchains
Global Market Data
Ecosystems
Research
Rewards
Heatmaps
Drop Hunting
Alerts
Converter
Widgets
Market Data API
Futures and Options
Affiliate Program
Bitcoin Flashes Inverted Triangle, Analyst Peter Brandt Explains What This Means

Share:
Veteran crypto analyst, Peter Brandt has uncovered an inverted or expanding triangle pattern in Bitcoin (BTC). Utilizing classical charting principles, Brandt analyzes the technical pattern formation, highlighting its potential impact on Bitcoin’s price trajectory.
What Bitcoin’s Inverted Triangle Pattern Means
On August 12, Brandt took to X (formerly Twitter) to shed light on a recent pattern formation in Bitcoin’s price chart. Sharing a price chart illustrating Bitcoin’s price movements from May 2023 to November 2024, the analyst identified a unique inverted or expanding Triangle pattern in Bitcoin.
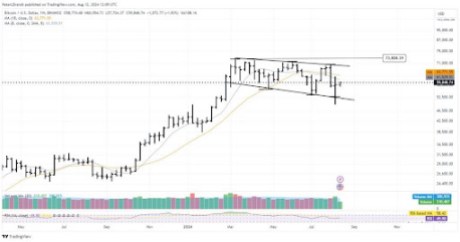
Usually, triangle-like shape patterns on the Bitcoin chart can indicate either a continuation or a reversal for Bitcoin’s price movements. The pattern depicted in Brandt’s post features two descending trend lines that are diverging from one another.
Brandt explains that while this pattern could be misconstrued as a bullish signal, the absence of a breakout means he would not be making any trades at this time. He emphasized that he does not make trades based on opinions but on established chart patterns.
The crypto analyst further mentioned that he avoids trading when a price is range-bound without a clear trend and only enters trades when a pattern is completed.
After Brandt described Bitcoin’s chart pattern as an inverted or expanding triangle, a crypto member proposed that it could be better described as a “descending broadening wedge.” Brandt responded by explaining that despite the variety of names for patterns, he prefers to use the terminology established by Schabacker, Magee, and Edwards, who are regarded as the founders of classical charting.
Concurring with Brandt’s view that “no breakout yet, so no trade,” a crypto community member noted that Bitcoin has been in a hold position for over a year, suggesting that it may not be the right time to trade. Brandt agreed but emphasized that, as a trader, he prioritizes risk management and prefers not to go against his established trading strategies.
A final crypto member suggested that the inverted or expanding triangle pattern in Bitcoin may be a “bullish megaphone or bull flag.” Brandt responded by clarifying that, while some might label the pattern as a bull flag, it does not align with the definitions set by the founders of classical charting.
Insights On Brandt’s Classical Charting Principles
In a more recent X post, Brandt discussed in detail the effectiveness of using classical chart patterns for trading. He revealed that once classical chart patterns are identified, they are resolved in three distinct ways.
Brandt noted that these patterns often morph into something unexpected 50% of the time, failing to follow initial predictions. He added that 25% of the time, classical chart patterns breakout in the anticipated direction but then fail to sustain movement, leading to a reversal or loss. Lastly, in the remaining 25% of cases, the patterns break out as predicted and move towards the projected target, fulfilling the anticipated scenario.
In This News
Coins

$ 84.00K
+1.28%
$ 1.74
-1.16%
$ 0.0132
+3.54%
$ 0.115
-0.03%
$ 0.00...361


Share:
In This News
Coins
$ 84.00K
+1.28%$ 1.74
-1.16%$ 0.0132
+3.54%$ 0.115
-0.03%$ 0.00...361
Share:
Read More

Bitcoin Deleveraging Finally Over? What The Derivatives Data Says

Why Gold & Silver’s All-Time Highs Are Very Bullish For Bitcoin And Altcoins
Bitcoin Flashes Inverted Triangle, Analyst Peter Brandt Explains What This Means
Share:
Veteran crypto analyst, Peter Brandt has uncovered an inverted or expanding triangle pattern in Bitcoin (BTC). Utilizing classical charting principles, Brandt analyzes the technical pattern formation, highlighting its potential impact on Bitcoin’s price trajectory.
What Bitcoin’s Inverted Triangle Pattern Means
On August 12, Brandt took to X (formerly Twitter) to shed light on a recent pattern formation in Bitcoin’s price chart. Sharing a price chart illustrating Bitcoin’s price movements from May 2023 to November 2024, the analyst identified a unique inverted or expanding Triangle pattern in Bitcoin.
Usually, triangle-like shape patterns on the Bitcoin chart can indicate either a continuation or a reversal for Bitcoin’s price movements. The pattern depicted in Brandt’s post features two descending trend lines that are diverging from one another.
Brandt explains that while this pattern could be misconstrued as a bullish signal, the absence of a breakout means he would not be making any trades at this time. He emphasized that he does not make trades based on opinions but on established chart patterns.
The crypto analyst further mentioned that he avoids trading when a price is range-bound without a clear trend and only enters trades when a pattern is completed.
After Brandt described Bitcoin’s chart pattern as an inverted or expanding triangle, a crypto member proposed that it could be better described as a “descending broadening wedge.” Brandt responded by explaining that despite the variety of names for patterns, he prefers to use the terminology established by Schabacker, Magee, and Edwards, who are regarded as the founders of classical charting.
Concurring with Brandt’s view that “no breakout yet, so no trade,” a crypto community member noted that Bitcoin has been in a hold position for over a year, suggesting that it may not be the right time to trade. Brandt agreed but emphasized that, as a trader, he prioritizes risk management and prefers not to go against his established trading strategies.
A final crypto member suggested that the inverted or expanding triangle pattern in Bitcoin may be a “bullish megaphone or bull flag.” Brandt responded by clarifying that, while some might label the pattern as a bull flag, it does not align with the definitions set by the founders of classical charting.
Insights On Brandt’s Classical Charting Principles
In a more recent X post, Brandt discussed in detail the effectiveness of using classical chart patterns for trading. He revealed that once classical chart patterns are identified, they are resolved in three distinct ways.
Brandt noted that these patterns often morph into something unexpected 50% of the time, failing to follow initial predictions. He added that 25% of the time, classical chart patterns breakout in the anticipated direction but then fail to sustain movement, leading to a reversal or loss. Lastly, in the remaining 25% of cases, the patterns break out as predicted and move towards the projected target, fulfilling the anticipated scenario.
In This News
Coins
$ 84.00K
+1.28%$ 1.74
-1.16%$ 0.0132
+3.54%$ 0.115
-0.03%$ 0.00...361
Share:
In This News
Coins
$ 84.00K
+1.28%$ 1.74
-1.16%$ 0.0132
+3.54%$ 0.115
-0.03%$ 0.00...361
Share:
Read More
Bitcoin Deleveraging Finally Over? What The Derivatives Data Says