Solana drops below $100 as bearish trend persists: check forecast

Share:
Predictions Markets
See what traders are focused on


Solana’s SOL is the worst performer among the top 10 cryptocurrencies by market cap as it lost 6% of its value in the last 24 hours.
The bearish performance resulted in SOL dropping below the $100 level once again, with further selloff expected in the near term.
Institutional and retail demand for Solana continues to decline, while on-chain data shows a record 150 million daily transactions on Tuesday.
Declining demand could push SOL below $90
SOL is the worst performer among the leading cryptocurrencies after losing 6% of its value since Tuesday.
The bearish performance comes despite Solana recording massive daily transactions.
According to Blockworks, Solana recorded more than 150 million transactions on Tuesday, with 1,743 transactions made per second (TPS).
However, the strong on-chain demand hasn’t affected institutional inflow into the Solana ecosystem.
SoSoValue reveals that US SOL-focused Exchange-Traded Funds (ETFs) recorded an inflow of $1.24 million on Tuesday, building on the $5.58 million inflow on Monday.
In addition to that, the derivatives market indicates bearish sentiment toward Solana amid capital outflows.
Official data obtained from CoinGlass shows that SOL Open Interest (OI) declined by 1.24% over 24 hours to $6.65 billion.
The decline indicates that capital was withdrawn either through position closures or by reducing leveraged positions.
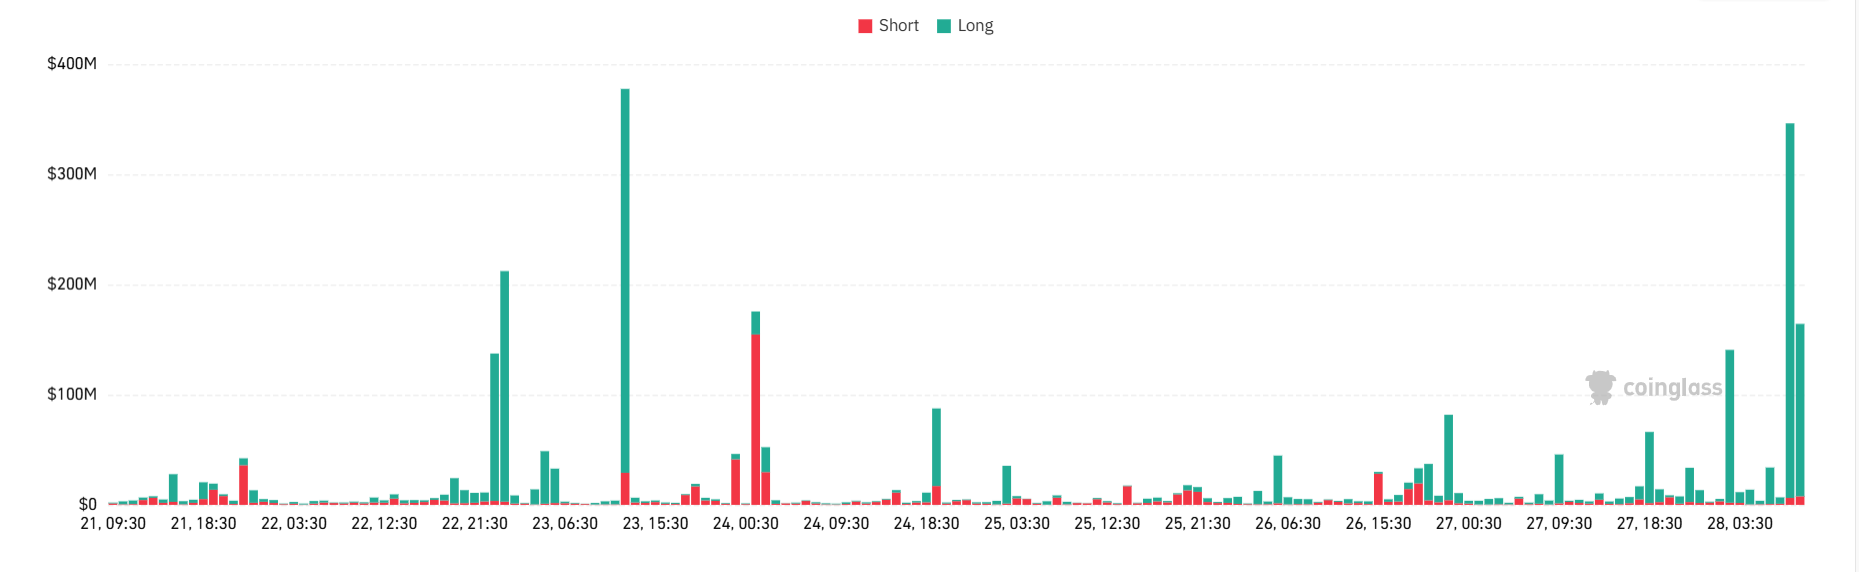
The position closures suggest a bearish bias, with long liquidations of $22.31 million over the same period, almost 5x the short liquidations of $4.39 million.
Finally, the OI-weighted funding rate for Solana is down to -0.0238%, revealing a strong bearish sentiment among traders. It could also suggest building short positions within the market.
SOL’s decline aligns with the broader crypto market selloff, which recorded total liquidations of roughly $683 million over the last 24 hours, including $509 million in long liquidations.
Furthermore, the Fear and Greed Index at 14 on Wednesday shows that the broader cryptocurrency market is weakening, signalling intense risk-off sentiment among investors.
If the market sentiment remains bearish, Solana could experience further declines.
Is SOL heading towards the $85 support level?
Similar to BTC, ETH, and XRP, the SOLÚSD 4-hour chart is extremely bearish.
SOL is currently trading below its 50-, 100-, and 200-day Exponential Moving Averages (EMAs) at $127, $139, and $153, indicating a broader bearish bias.
At press time, SOL is trading at $96. If the daily candle closes below the $95 support, SOL will likely revisit the $85 psychological level in the near term.

The Moving Average Convergence Divergence (MACD) is deep within the negative territory, indicating an oversold condition.
The Relative Strength Index (RSI) is at 31 on the same chart and is heading towards the oversold zone, which could encourage a further sell-off.
However, if SOL reclaims the $100 resistance level, it could extend its recovery towards the 50-day EMA at $127.
The post Solana drops below $100 as bearish trend persists: check forecast appeared first on Invezz
In This News
Coins

$ 73.44K
-0.34%
$ 2.01K
+0.06%
$ 1.35
+2.76%
$ 82.20
-0.09%1654073624197.png)
$ 82.18
+0.19%Predictions Markets
See what traders are focused on
Share:
In This News
Coins
$ 73.44K
-0.34%$ 2.01K
+0.06%$ 1.35
+2.76%$ 82.20
-0.09%$ 82.18
+0.19%Predictions Markets
See what traders are focused on
Share:
Read More
Attention: Grayscale Names Four Altcoins! “US Law Will Benefit These Altcoins the Most!”