Stablecoin Market Report: In-Depth Analysis and Insights

Share:
Predictions Markets
See what traders are focused on

The post Stablecoin Market Report: In-Depth Analysis and Insights appeared first on Coinpedia Fintech News
Welcome to the monthly Stablecoin Report, where we delve into the dynamic landscape of stablecoins within the broader crypto market. While writing this report, the global crypto market reached an impressive valuation of $1.55 trillion, showcasing the growing influence of digital assets worldwide.
Within this expansive market, stablecoins play a crucial role, with a cumulative market cap of $134.51 billion. This substantial figure represents approximately 8.68% of the entire global crypto market, underscoring the significance and stability that stablecoins bring to the overall ecosystem.
Our analysis will comprehensively examine the stablecoin sector, leveraging the most reliable data from authoritative sources. Join us as we explore the intricate dynamics, trends, and developments shaping the world of stablecoins in this month’s report.
1. Top Stablecoins: A Simple Analysis
To do a simple analysis to understand the market’s top stablecoins this month, we generally consider three parameters: market capitalization, market dominance, and trading volume.
1.1. Top Stablecoins by Market Capitalisation
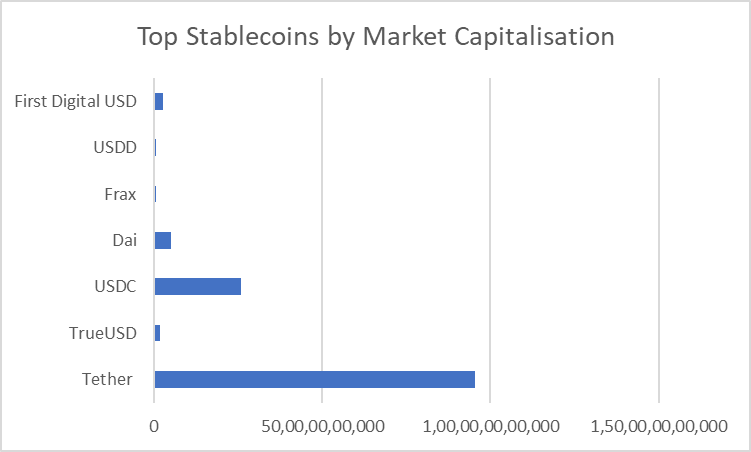
| Stablecoins | Market Capitalisation |
| Tether | $95,512,604,444 |
| TrueUSD | $1,837,736,389 |
| USDC | $25,853,040,903 |
| Dai | $5,187,453,830 |
| Frax | $648,327,962 |
| USDD | $720,341,121 |
| First Digital USD | $2,647,942,680 |
Tether dominates the stablecoin market with a massive $95.5 billion market capitalization. USDC follows, with $25.9 billion, respectively. Dai, First Digital USD, and TrueUSD are other prominent contestants in the stablecoin market.
1.2. Top Stablecoins by Market Dominance
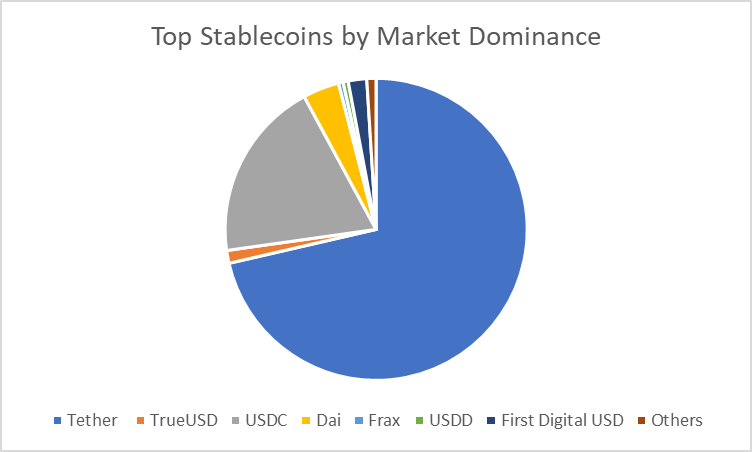
| Stablecoins | Market Dominance |
| Tether | 72.1% |
| TrueUSD | 1.39% |
| USDC | 19.53% |
| Dai | 3.93% |
| Frax | 0.49% |
| USDD | 0.55% |
| First Digital USD | 2.00% |
| Others | 0.01 |
Tether commands the stablecoin market with a dominant 72.2% market share, underscoring its widespread use and significance. Following at a distance are USDC (19.53%) and First Digital USD (2.00%). TrueUSD, DAI, USDD, and Frax contribute to market diversity.
1.3. Top Stablecoins by Trading Volume
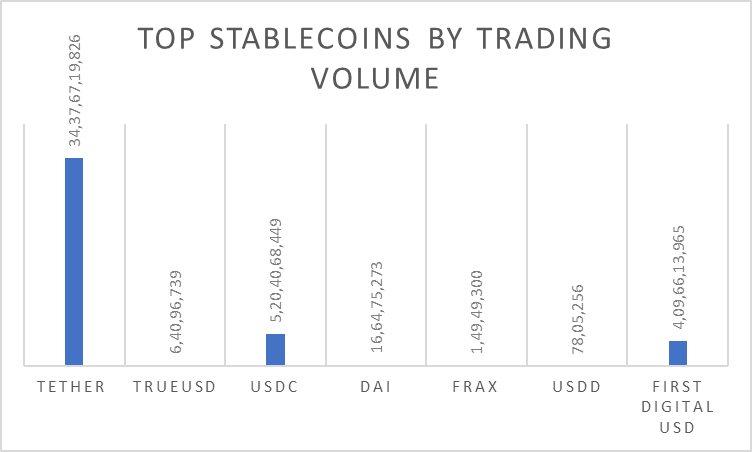
| Stablecoins | Trading Volume |
| Tether | $34,376,719,826 |
| TrueUSD | $64,096,739 |
| USDC | $5,204,068,449 |
| Dai | $166,475,273 |
| Frax | $14,949,300 |
| USDD | $7,805,256 |
| First Digital USD | $4,096,613,965 |
Tether leads the stablecoin market in trading volume with $34.4 billion, indicating its high liquidity and extensive use in crypto transactions. USDC follows with a substantial volume of $5.2 billion, highlighting ist active participation in the market. First Digital USD also demonstrates significant trading activity at around $4.1 billion.
2. Stablecoin Price Analysis: An In-Depth Overview
Tether, USD Coin, Dai, First Digital USD, TrueUSD, USDD, and FRAX are the top seven stablecoins on the basis of market capitalisation, at the time of writing this report.
Let’s do an in-depth price analysis focusing on these seven coins.
2.1. Stablecoin One Month Change
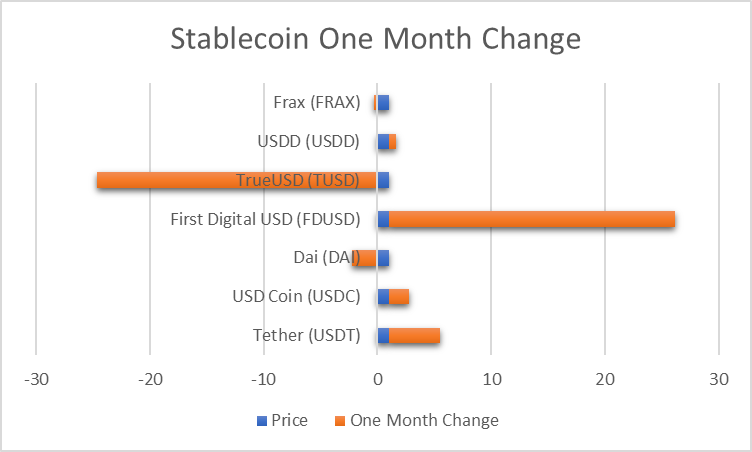
| Stablecoins | Price | One Month Change |
| Tether (USDT) | $0.9992 | +4.52% |
| USD Coin (USDC) | $0.9997 | +1.81% |
| Dai (DAI) | $0.9995 | -2.25% |
| First Digital USD (FDUSD) | $0.9975 | +25.14% |
| TrueUSD (TUSD) | $0.9839 | -24.69% |
| USDD (USDD) | $0.9940 | +0.60% |
| Frax (FRAX) | $0.9977 | -0.27% |
Over the past month, stablecoins have experienced varied price changes. Notably, First Digital USD (FDUSD) surged by an impressive 25.14%, showcasing significant market demand. Tether (USDT) also demonstrated strength, gaining 4.52%, while TrueUSD (TUSd) saw a decline of 24.69%. These fluctuations indicate the dynamic nature of stablecoin values.
2.2. Stablecoin One Month % Off Peg
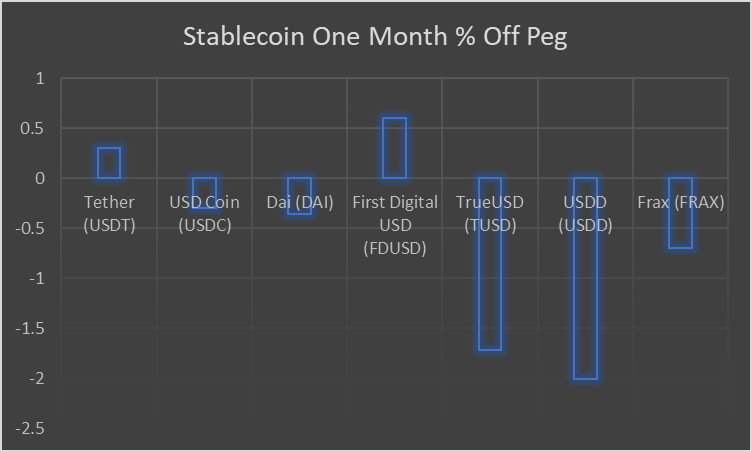
| Stablecoins | 1M % Off Peg |
| Tether (USDT) | +0.30 |
| USD Coin (USDC) | -0.30 |
| Dai (DAI) | -0.36 |
| First Digital USD (FDUSD) | +0.60 |
| TrueUSD (TUSD) | -1.72 |
| USDD (USDD) | -2.01 |
| Frax (FRAX) | -0.70 |
Stablecoins’ performance relative to their pegs over the past month shows varied results. Tether (USDT) and First Digital USD (FDUSD) managed slight positive deviations of +0.30% and +0.60%, respectively. TrueUSD (TUSd) and USDD experienced extreme negative deviations of -1.72% and -2.01%, indicating a drift below their pegs.
3. Stablecoins in Blockchains: A Detailed Overview
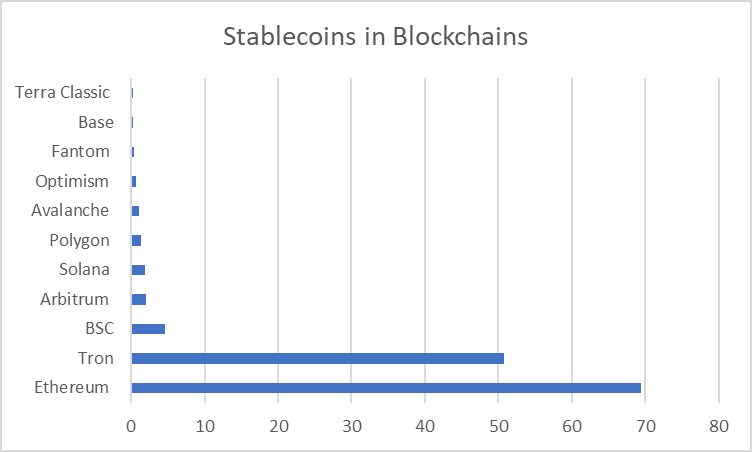
| Blockchains | Stablecoins Market Cap |
| Ethereum | $69.467b |
| Tron | $50.823b |
| BSC | $4.613b |
| Arbitrum | $2.078b |
| Solana | $1.927b |
| Polygon | $1.316b |
| Avalanche | $1.099b |
| Optimism | $603.01m |
| Fantom | $341.69m |
| Base | $296.63m |
| Terra Classic | $215.81m |
Ethereum stands as the leader in hosting stablecoins, commanding a substantial market cap of $69.47 billion, underlining its dominance in decentralised finance (DeFi). Tron, with a $50.82 billion market cap, signifies a robust alternative for stablecoin transactions. Binance Smart Chain (BSC) follows suit with $4.61 billion, highlighting its emerging role in the crypto space. The presence of stablecoins on Arbitrium, Solana, Polygon, Avalanche, Optimism, Fantom, Base and Terra Classic showcases the diversification of blockchain platforms in supporting the stablecoin ecosystem.
3.1. USDT Dominance in Blockchains
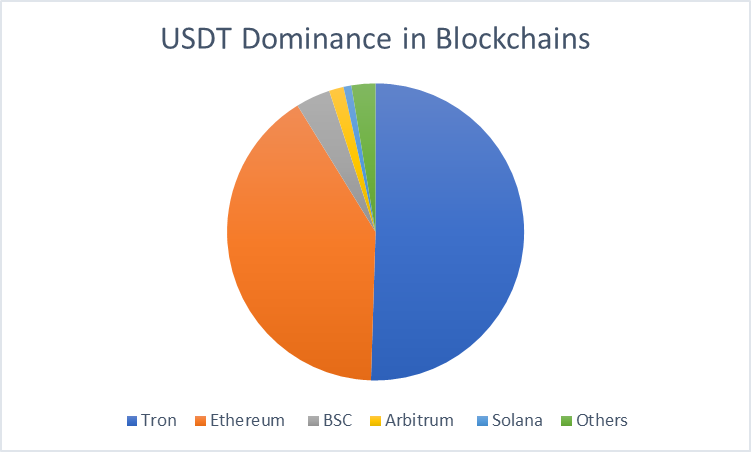
| Blockchains | USDT Dominance | Total Circulating |
| Tron | 50.5% | 48.247b |
| Ethereum | 40.69% | 38.876b |
| BSC | 3.75% | 3.581b |
| Arbitrum | 1.59% | 1.52b |
| Solana | 0.86% | 820.08m |
| Others | 2.61% |
Tron leads in USDT dominance among blockchains with 50.5%, reflecting its significant role in supporting Tether transactions. Ethereum follows closely with 40.69%, indicating its prominence in hosting the stablecoin. BSC, Arbitrum, and Solana contribute to the ecosystem with 3.74%, 1.59%, and 0.86% USDT dominance, respectively. These percentages highlight the distribution of Tether across various blockchains, emphasising Tron and Ethereum as key platforms. The total circulating supply further emphasises Tron’s and Ethereum’s larger role in facilitating Tether transactions compared to other blockchains in the dataset.
3.2. USD Coin Dominance in Blockchains
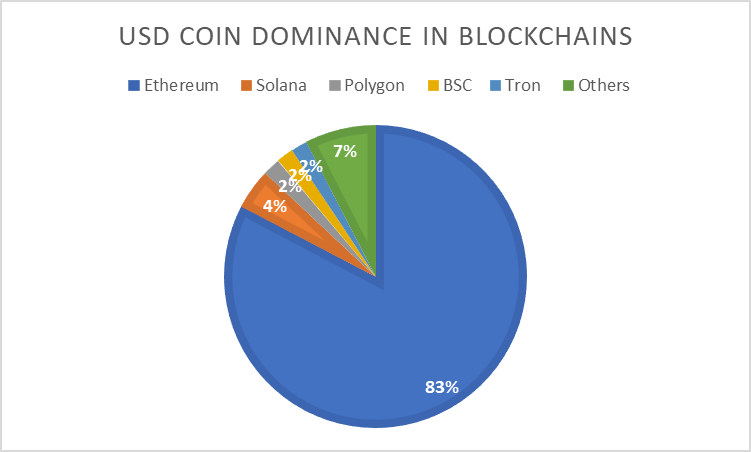
| Blockchains | USD Coin Dominance | Total Circulating |
| Ethereum | 82.7% | 20.544b |
| Solana | 4.34% | 1.078b |
| Polygon | 1.85% | 460.19m |
| BSC | 1.81% | 448.98m |
| Tron | 1.74% | 433.5m |
| Others | 7.56% |
Ethereum dominates the USD Coin (USDC) landscape among blockchains with an impressive 82.7% dominance, showcasing its crucial role in supporting USDC transactions. Solana follows with a 4.34% share, indicating its growing significance. Polygon, Binance Smart Chain (BSC), and Tron contribute with 1.85%, 1.81%, and 1.74% dominance, respectively. These percentages reflect the distribution of USDC across various blockchains, highlighting Ethereum’s substantial influence. The total circulating supply further underscore Etheruem’s lead.
3.3. Dai Dominance in Blockchains
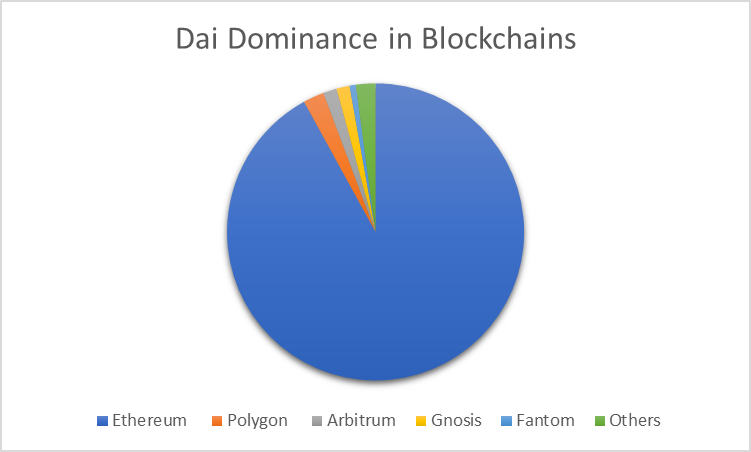
| Blockchains | Dai Dominance | Total Circulating |
| Ethereum | 92% | 4.724b |
| Polygon | 2.28% | 117.08m |
| Arbitrum | 1.48% | 75.77m |
| Gnosis | 1.43% | 73.39m |
| Fantom | 0.68% | 35.12m |
| Others | 2.13% |
Ethereum overwhelmingly dominates the Dai landscape among blockchains with an impressive 92% dominance, emphasising its integral role in supporting Dai transactions. Polygon, Arbiturm, Gnosis, Fantom contribute with 2.28%, 1.48%, 1.43%, and 0.68% dominance, respectively. These percentages highlight the distribution of Dai across various blockchains, with Ethereum being the primary host. The total circulating supply underscores Ethereum’s significant influence.
3.4. First Digital USD Dominance in Blockchains
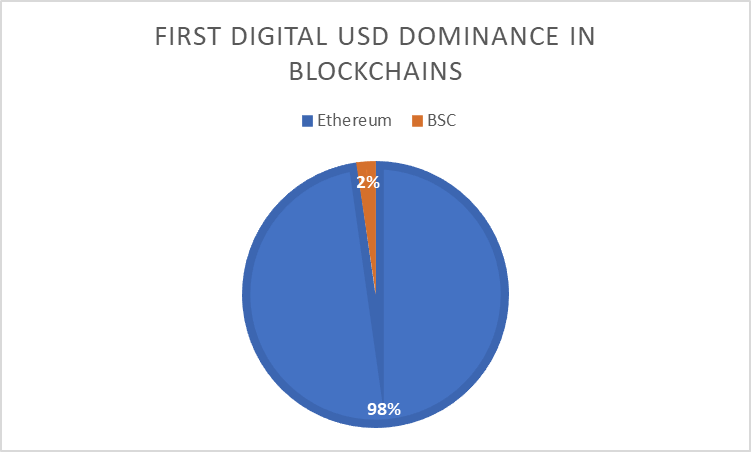
| Blockchains | First Digital USD Dominance | Total Circulating |
| Ethereum | 97.76% | 2.155b |
| BSC | 2.24% | 49.38m |
Ethereum overwhelmingly dominates the First Digital USD (FDUSD) landscape also, with an impressive 97.76% dominance, showcasing its central role in supporting FDUSD transactions. Binance Smart Chain (BSC) follows with a 2.24% share, indicating a lesser but still present influence. The total circulating supply underscores Ethereum’s overwhelming dominance.
3.5. TrueUSD Dominance in Blockchains
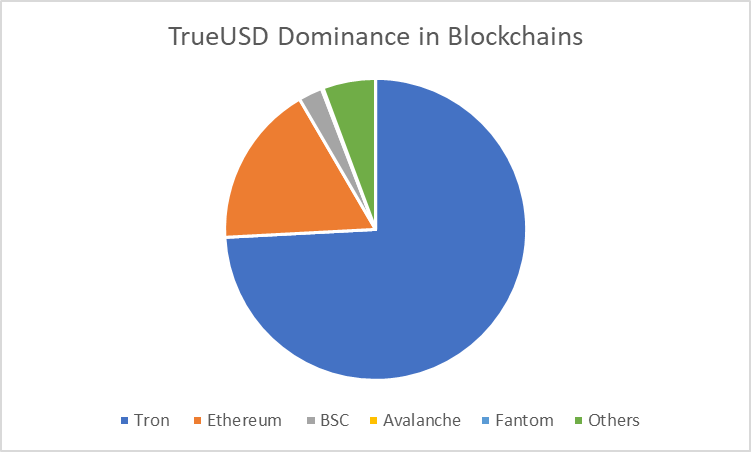
| Blockchains | TrueUSD Dominance | Total Circulating |
| Tron | 78.57% | 1.441b |
| Ethereum | 18.46% | 338.58m |
| BSC | 2.72% | 49.94m |
| Avalanche | 0.16% | 2.98m |
| Fantom | 0.03% | 467,469 |
| Others | 0.06 |
Tron dominates the TrueUSD landscape among blockchains with an impressive 78.57% dominance, underscoring its significant role in supporting TrueUSD transactions. Ethereum follows with an 18.46% share, indicating a notable but smaller influence. Binance Smart Chain contributes 2.72%, while Avalanche and Fantom hold 0.16% and 0.03% dominance respectively. The total circulating supply clearly underscores Tron’s dominance.
3.6. USDD Dominance in Blockchains
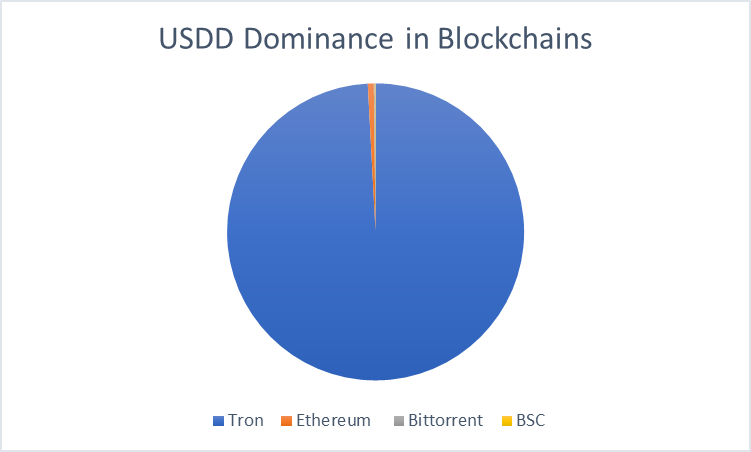
| Blockchains | USDD Dominance | Total Circulating |
| Tron | 99.16% | 719.27m |
| Ethereum | 0.65% | 4.68m |
| Bittorrent | 0.1% | 694,205 |
| BSC | 0.09% | 683,879 |
Tron overwhelmingly dominates the USDD landscape among blockchains with an exceptional 99.16% dominance, highlighting its central role in supporting USDD transactions. Ethereum, Bittorrent, and Binance Smart Chain (BSC) contribute with 0.65%, 0.1%, and 0.09% dominance, respectively, indicating marginal influence. The total circulating supply further underscores Tron’s dominance.
3.7. Frax Dominance in Blockchains
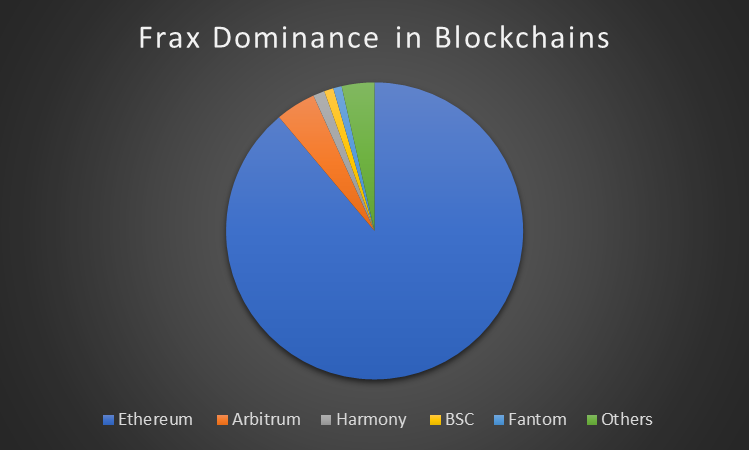
| Blockchains | Frax Dominance | Total Circulating |
| Ethereum | 88.88% | 577.22m |
| Arbitrum | 4.37% | 28.38m |
| Harmony | 1.25% | 8.14m |
| BSC | 1.01% | 6.54m |
| Fantom | 0.92% | 5.99m |
| Others | 3.57% |
Ethereum leads in Frax dominance among blockchains with a substantial 88.88%, emphasising its important role in supporting Frax transactions. Arbitrum, Harmony, Binance Smart Chain, and Fantom contribute with 4.37%, 1.25%, 1.01%, and 0.92% dominance, respectively. The total circulating supply further underscore Ethereum’s dominance.
4. Stablecoins in Exchanges: A Simple Analysis
Let’s examine the level of engagement of stablecoins on cryptocurrency exchanges, by focusing on the top three centralised and decentralised exchanges, exploring whether stablecoins feature prominently within the top five trading pairs on each platform.
4.1. Stablecoins in Centralised Exchanges
Binance, Coinbase Exchange and OKK are the top three centralised exchanges, on the basis of monthly visits, as they attract 74.2M, 44.1M and 30.5M, monthly visits, respectively. Let’s analyse these three centralised exchanges.
4.1.1. Most Active Trading Pairs in Binance
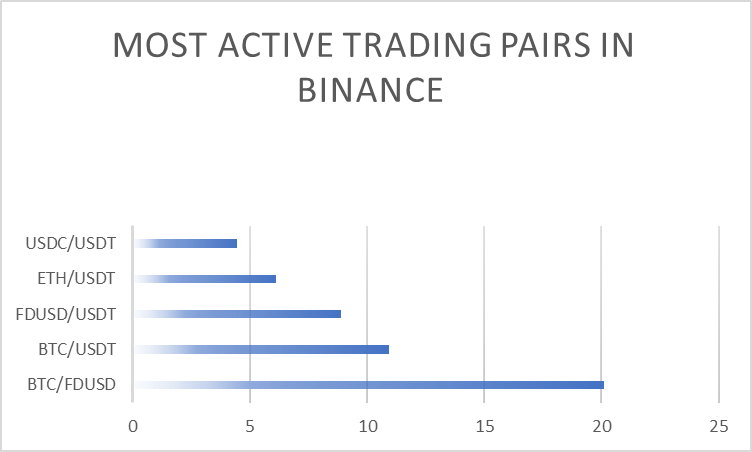
| Binance Top Trading Pairs | Volume % |
| BTC/FDUSD | 20.12% |
| BTC/USDT | 10.95% |
| FDUSD/USDT | 8.89% |
| ETH/USDT | 6.10% |
| USDC/USDT | 4.43% |
On Binance, stablecoins play a significant role in the most active trading pairs. BTC/FDUSD leads with 20.12%, followed by BTC/USDT at 10.95%, emphasising the prominence of both stablecoins (FDUSD and USDT) against major cryptocurrencies. FDUSD/USDT and ETH/USDT contribute 8.89% and 6.10%, showcasing the popularity of stablecoin trading pairs. Even USDC/USDT at 4.43% further underlines the relevance of stablecoins in trading activities.
4.1.2. Most Active Trading Pairs in Coinbase Exchange
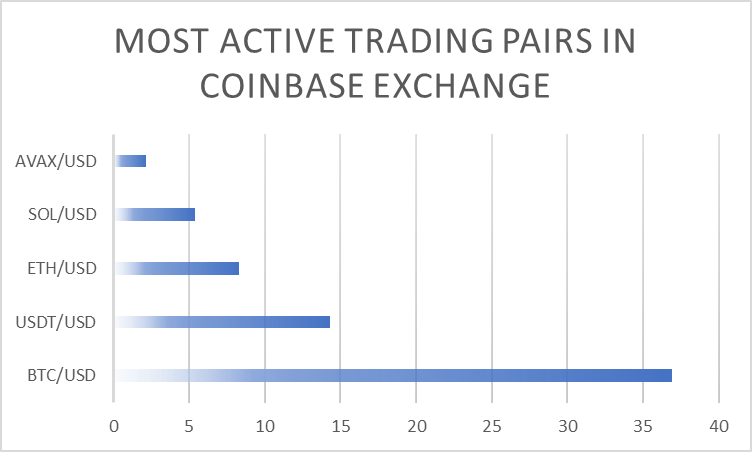
| Coinbase Top Trading Pairs | Volume % |
| BTC/USD | 36.95% |
| USDT/USD | 14.32% |
| ETH/USD | 8.33% |
| SOL/USD | 5.42% |
| AVAX/USD | 2.17% |
Coinbase’s most active trading pairs reveal a dominance of fiat-based pairs, with BTC/USD leading at 36.95%, showcasing the significance of trading against the US Dollar. USDT/USD, a stablecoin pair, holds a notable 14.3%, emphasising the continued role of stablecoins in trading. ETH/USD, SOL/USD, and AVAX/USD contribute with 8.33%, 5.42%, 2.17% respectively, highlighting the prevalence of major cryptocurrencies against the US Dollar.
4.1.3. Most Active Trading Pairs in OKK
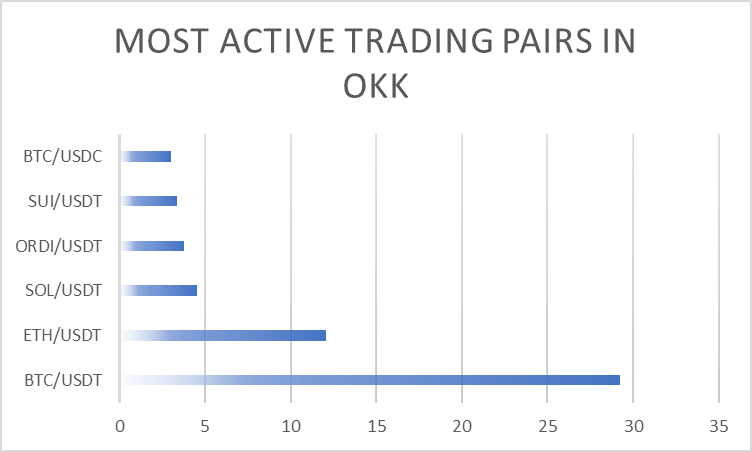
| OKK Top Trading Pairs | Volume % |
| BTC/USDT | 29.27% |
| ETH/USDT | 12.07% |
| SOL/USDT | 4.53% |
| ORDI/USDT | 3.75% |
| SUI/USDT | 3.37% |
| BTC/USDC | 3.00% |
In OKK, trading pairs against USDT dominate, with BTC/USDT leading at 29.27%, showcasing a preference for stablecoin-based trading. ETH/USDT follows with 12.07%, emphasising the role of stablecoins in major cryptocurrency pairs. SOL/USDT, ORDI/USDT, and SUI/USDT contribute with 4.53%, 3.75%, 3.37%, respectively. Additionally, BTC/USDC at 3.00% adds to the stablecoin influence.
4.2. Stablecoins in Decentralised Exchanges
Uniswap V3 (Ethereum), Jupiter, and Uniswap V3 (Arbitrum One) are the three top decentralised exchanges, on the bases of market share by volume, as they enjoy 20.6%, 12.7% and 7.4% market share by volume, respectively. Let’s analyse these three decentralised exchanges.
4.2.1. Most Active Trading Pairs in Uniswap V3 (Ethereum)
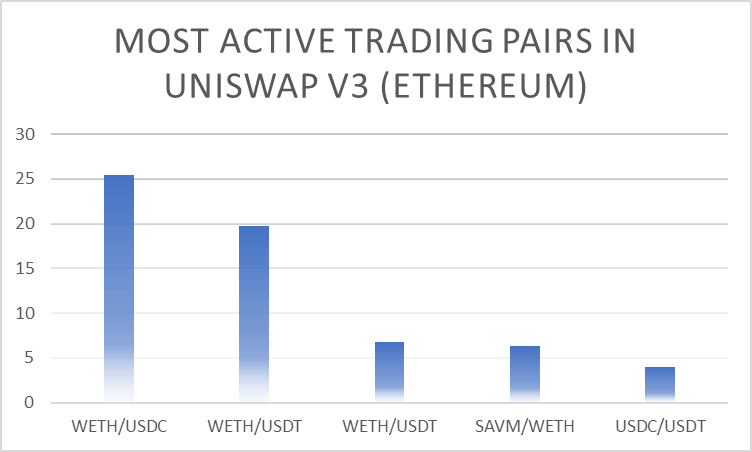
| Uniswap V3 (Ethereum) Top Trading Pairs | Volume % |
| WETH/USDC | 25.41% |
| WETH/USDT | 19.78% |
| WETH/USDT | 6.75% |
| SAVM/WETH | 6.35% |
| USDC/USDT | 4.00% |
On Uniswap V3 (Ethereum), stablecoins play a prominent role in the most active trading pairs. WETH/USDC leads with 25.41%, emphasising the popularity of trading against the US Dollar through the stablecoin USDC. WETH/USDT follows at 19.78%, further highlighting the preference of stablecoins. SAVM/WETH and USDC/USDT contribute 6.35% and 4.00%, respectively, indicating a consistent use of stablecoins within the top trading pairs.
4.2.2. Most Active Trading Pairs in Jupiter
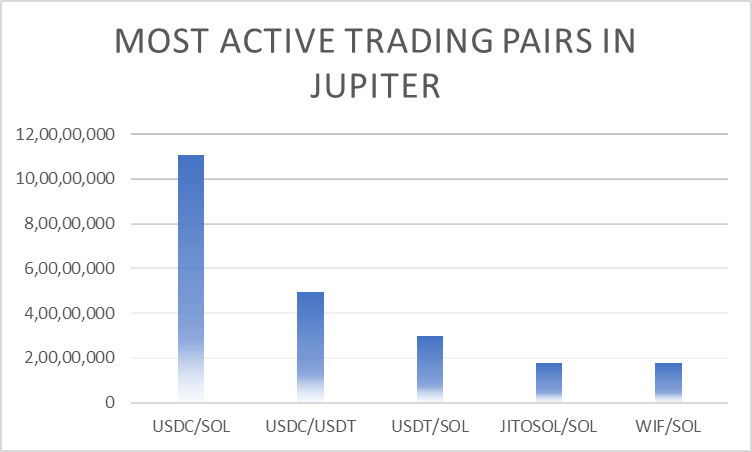
| Jupiter Top Trading Pairs | 24h Volume |
| USDC/SOL | $110,608,407 |
| USDC/USDT | $49,254,617 |
| USDT/SOL | $29,657,862 |
| JITOSOL/SOL | $17,830,502 |
| WIF/SOL | $17,770,533 |
In Jupiter, the most active trading pairs reveal a dominance of stablecoins. USDC/SOL leads with $110,608,407, showcasing the popularity of trading against a stable value. USDC/USDT follows at $49,254,617, emphasising the significance of stablecoins in trading activities. USDT/SOL, JITOSOL/SOL, and WIF/SOL contribute to the ecosystem, reflecting the influence of stablecoins within the top trading pairs.
4.2.3. Most Active Trading Pairs in Uniswap V3 (Arbitrum One)
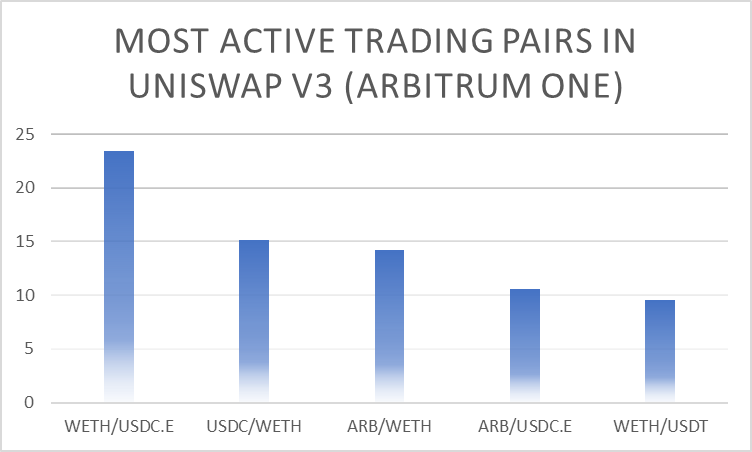
| Uniswap V3 (Arbitrum One) Top Trading Pairs | Volume % |
| WETH/USDC.E | 23.39% |
| USDC/WETH | 15.16% |
| ARB/WETH | 14.19% |
| ARB/USDC.E | 10.60% |
| WETH/USDT | 9.56% |
On Uniswap V3 (Arbitrum One), stablecoins play a key role in the most active trading pairs. WETH/USDC.E leads with 23.39%, highlighting the significance of trading against a stable value. USDC/WETH follows at 15.16%, emphasising the importance of stablecoins in trading activities. ARB/WETH, ARB/USDC.E, and WETH/USDT contribute 14.19%, 10.60%, and 9.56%, respectively, showcasing the continued influence of stablecoins within the top trading pairs.
In This News
Coins

$ 64.19K
+1.52%
$ 1.80K
+2.80%
$ 0.330
-0.43%
$ 0.99928
+0.01%
$ 109.19
+1.13%


Predictions Markets
See what traders are focused on
Share:
In This News
Coins
$ 64.19K
+1.52%$ 1.80K
+2.80%$ 0.330
-0.43%$ 0.99928
+0.01%$ 109.19
+1.13%Predictions Markets
See what traders are focused on
Share:
Read More

Circle (CRCL) Wins Final OCC Approval for National Trust Bank