XRP Could Retest Triangle Support At $2.72, Analyst Warns
Share:
Predictions Markets
See what traders are focused on

XRP has been declining over the past few days, making a retest of this Descending Triangle’s lower boundary possible, according to an analyst.
XRP Has Been Moving Inside A Descending Triangle Recently
In a new post on X, analyst Ali Martinez has talked about where XRP may be heading next, based on a Descending Triangle. This technical analysis (TA) pattern forms when an asset’s price witnesses consolidation between two converging trendlines.
The main feature of the pattern is that its lower trendline is parallel to the time-axis. This level acts as a support boundary, while the upper level, which is slopped downward, provides resistance to the price. Thus, as the asset trades inside a Descending Triangle, its range shrinks to a downside.
A break out of either of the trendlines can imply a continuation of trend in that direction. This means that a surge above the triangle can be a bullish signal, while a decline under it a bearish one.
Like the Descending Triangle, there is also the Ascending Triangle in TA, which works similarly, except for the fact that the orientation of the trendlines is flipped; the upper line is the one parallel to the time-axis instead.
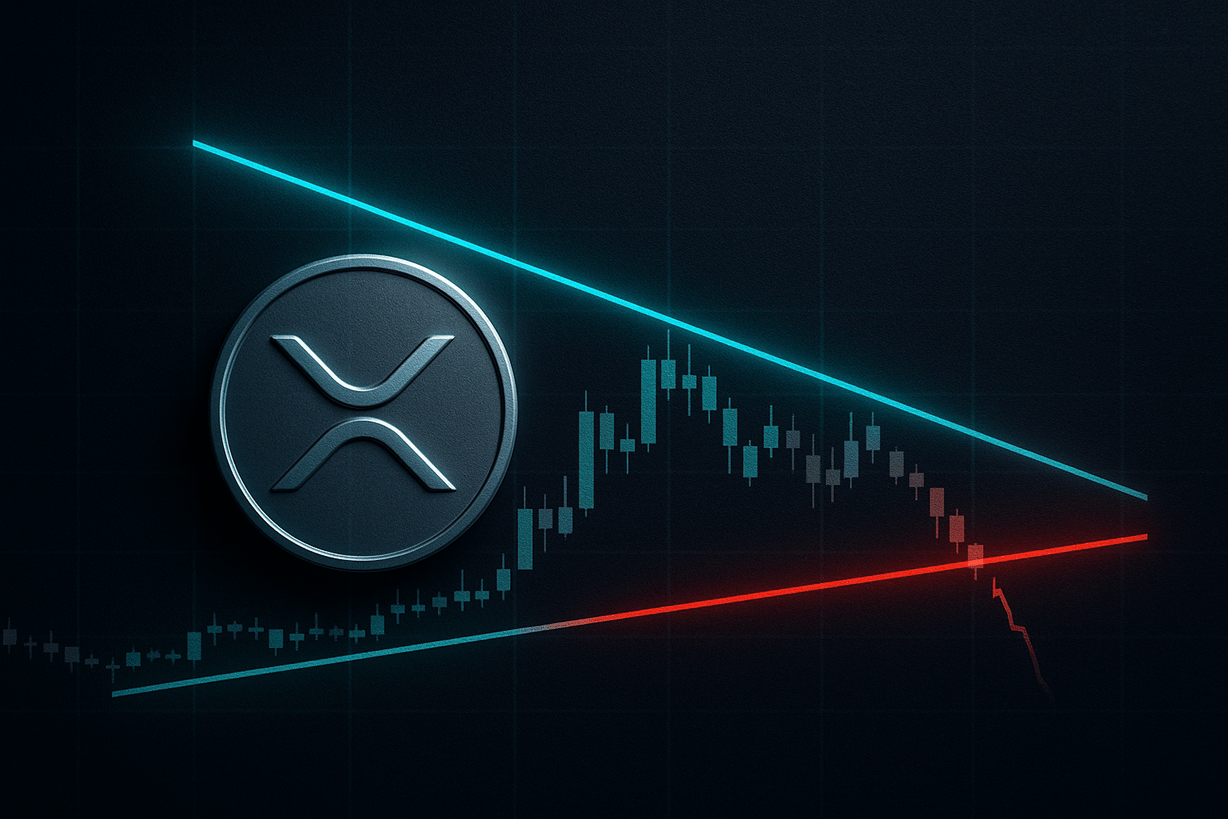
Now, here is the chart shared by the analyst that shows the Descending Triangle that the 1-day price of XRP has been stuck inside for the last few months:

As displayed in the above graph, XRP made a retest of the Descending Triangle’s upper trendline earlier in the month, but it was unable to break past the resistance. The coin has since been on the way down and has traveled roughly halfway through the distance between the trendlines.
“It looks like XRP is heading for a retest of the triangle’s bottom at $2.72,” notes Martinez. From the current exchange rate of the asset, a fall to this target would imply a loss of almost 7%.
From the chart, another development related to the cryptocurrency is also visible: its price is slowly inching toward the apex of the triangle. Generally, breakouts become more likely to occur the closer the asset gets to the end of the channel. This is because the range gets progressively tighter over the course of a triangle.
Thus, the next retest of either trendline could be interesting, as it may pave the way to a breakout. It only remains to be seen, though, which level XRP will retest next.
XRP Price
At the time of writing, XRP is floating around $0.292, down 3% over the last seven days.
In This News
Coins

$ 0.0614
+2.59%
$ 1.09
+1.43%
$ 0.00599
-0.63%
$ 0.0705
+0.45%
$ 213.96


Predictions Markets
See what traders are focused on
Share:
In This News
Coins
$ 0.0614
+2.59%$ 1.09
+1.43%$ 0.00599
-0.63%$ 0.0705
+0.45%$ 213.96
Predictions Markets
See what traders are focused on
Share:
Read More
XRP Price Prediction: XRP's Macro Chart Is Flashing a Potential $18 Rally