Bitcoin Crash To $87,600 Looms If This Support Snaps, Warns Veteran Analyst

Share:
Predictions Markets
See what traders are focused on

Bitcoin is sitting on a technical ledge that could decide whether price makes a new all-time high or unwinds sharply into the $80,000s, according to veteran trader Josh Olszewicz (CarpeNoctom). “BTC complex iHS brewing in the megaphone,” he posted on October 30, 2025, adding in a follow-up: “Also this brewing, not great.”
The Bullish Case For Bitcoin
Olszewicz is tracking two structures. The first, on the 6-hour timeframe, shows BTC trading inside a broadening “megaphone” pattern that has contained price since July. The megaphone is defined by rising dotted resistance lines above and falling dotted support lines below. The upper boundary extends through roughly $126,000 to $128,000. The lower boundary widens down toward $105,400 and $103,800.
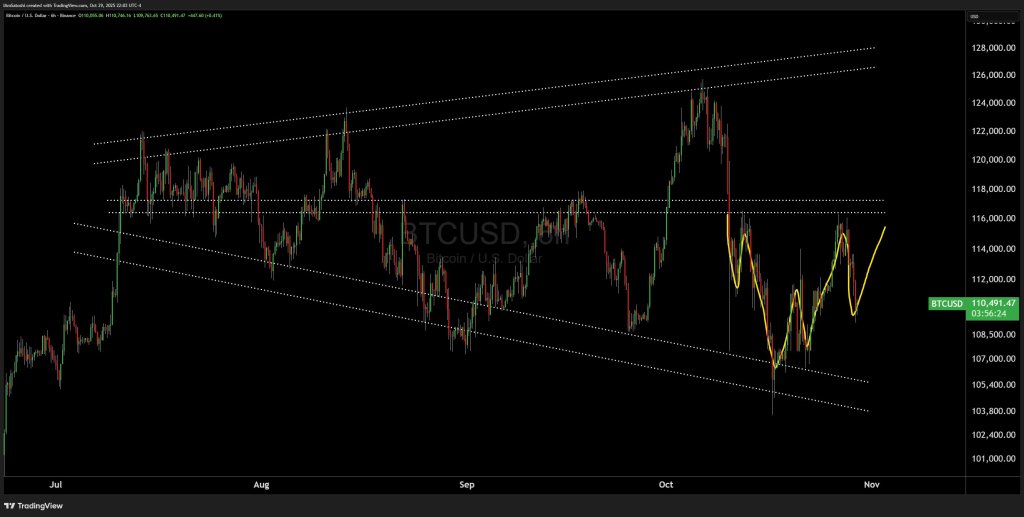
Within that range, Bitcoin put in a sharp spike above $126,000 in early October, then sold off violently, dropping below $106,000s with a wick toward roughly $102,000. That bounce failed to recover the prior range. Instead, price stalled under a horizontal resistance shelf around $116,000–$117,000. Olszewicz sketches a yellow projected path that implies a short-term bounce from just under $111,000 back towards $116,000. That path suggests attempted relief, not confirmed bullish continuation.
Only if Bitcoin can reclaim the $116,000–$117,000 zone does a move toward the upper resistance band come back into play. In that scenario, price could extend toward $128,000, print a new all-time high, and potentially restart a broader recovery phase.
The Bearish Case For Bitcoin
The second chart is where the downside risk accelerates. On the 1-day timeframe, Olszewicz maps a head-and-shoulders top with a rising neckline. The left shoulder topped in the $118,000 area, the head reached roughly $126,200, and the right shoulder again failed near $116,000. The neckline is drawn as an ascending dotted support line that now sits in the $105,000–$106,000 zone. He highlights $107,316.81 as the key breakdown level.
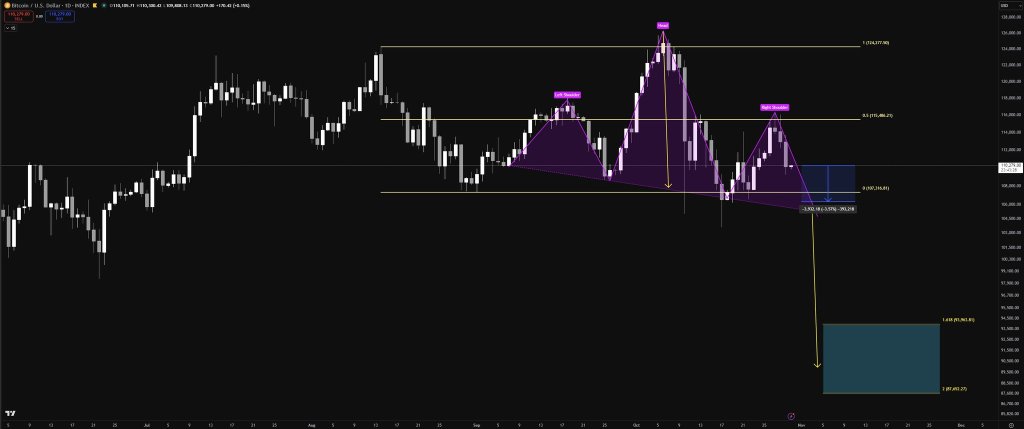
If that neckline breaks decisively, the chart applies a standard measured move. The distance from the head down to the neckline is projected lower. Olszewicz plots that extension into a teal target zone and marks intermediate and full objectives at $93,963.81 (the 1.618 extension) and $87,652.27 (the 2.0 extension). In other words, a clean daily breakdown through $107,316 opens a path first toward the mid-$90,000s and then toward roughly $87,600.
Above spot, resistance remains layered. The 0.5 retracement of the prior impulse is labeled at $115,486, and the 1.0 retracement — effectively the previous swing high — is marked at $124,477.
Structurally, Bitcoin is now boxed between supply in the $116,000 region and that neckline supports around $105,000–$106,000. Olszewicz’s message is that bulls may still be trying to form a “complex inverse head-and-shoulders in the megaphone,” but the active daily head-and-shoulders top is “not great.” A decisive loss of the neckline could confirm the bearish structure and put $93,963.81 and $87,652.27 on the table.
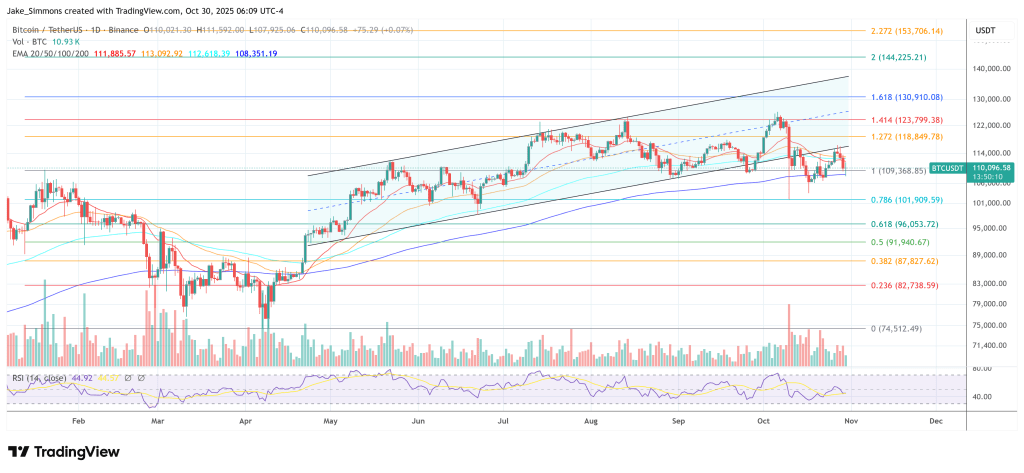
At press time, BTC traded at $110,096.
In This News
Coins

$ 63.99K
-1.79%
$ 0.0644
-0.54%
$ 0.00526
-2.95%
$ 0.0698
-0.83%
$ 0.00...361


Predictions Markets
See what traders are focused on
Share:
In This News
Coins
$ 63.99K
-1.79%$ 0.0644
-0.54%$ 0.00526
-2.95%$ 0.0698
-0.83%$ 0.00...361
Predictions Markets
See what traders are focused on
Share:
Read More

Bitcoin News: H100 Acquires 2,455 BTC as Active Addresses Fall to 2019 Low