Ripple Price Analysis: XRP Taps $2 But How Low Can it Go?
Share:
Predictions Markets
See what traders are focused on

XRP has entered a critical phase in its market structure, with bearish pressure intensifying across both its USD and BTC pairs.
After weeks of consolidation just above key support zones, the asset has now broken down, triggering concern among traders and investors alike. This shift in momentum reflects not only technical weakness but also XRP’s continued underperformance relative to both Bitcoin and other major altcoins.
XRP Price Analysis: Technical
By Shayan
The USDT Pair
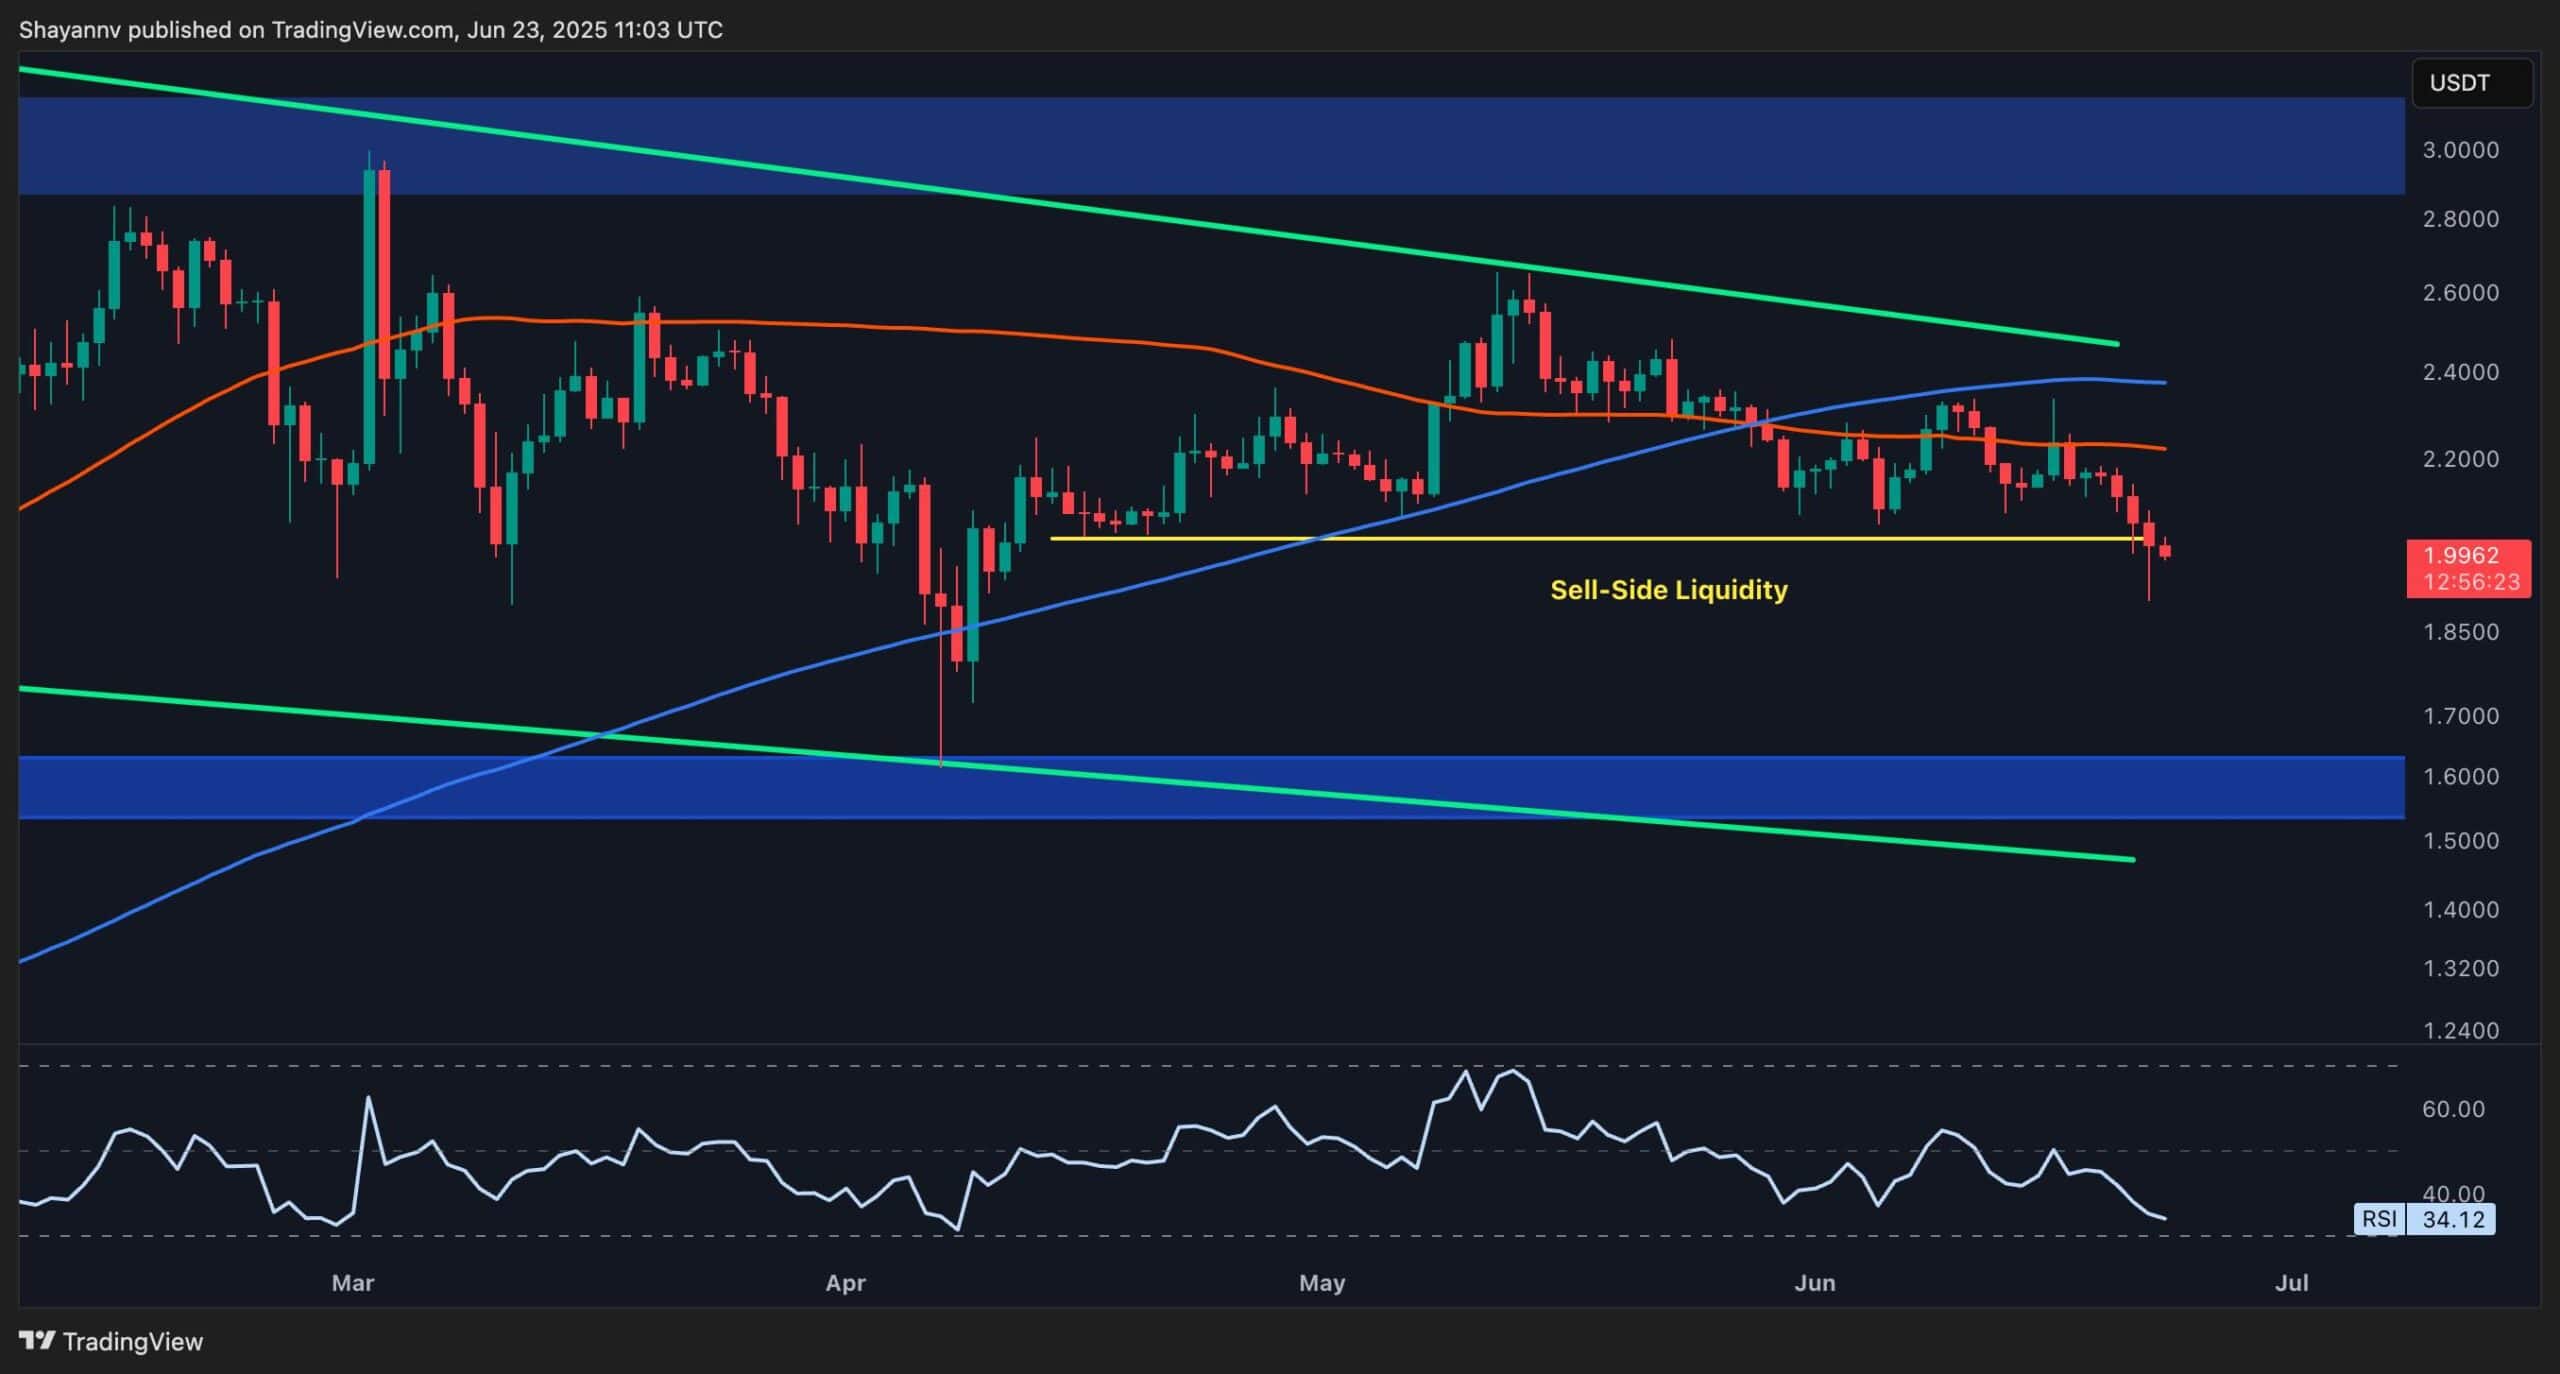
On the daily chart, XRPUSDT remains compressed within a long-term descending channel pattern, bounded by a descending trendline from the yearly highs and a horizontal support near $1.60.
Tons of sell-side liquidity resting below the $2 level have been swept today, as the pair is currently trading below both the 100 and 200 moving averages, which are located in the $2.20-$.240 range. The RSI is also hovering near 34, indicating the lack of momentum and confirming the range-bound behaviour. If sellers manage to breach $1.95, the next logical demand zone lies around $1.6.
Meanwhile, upside resistance remains at the upper bound of the channel near $2.40 and the moving averages mentioned earlier. A clean break and daily close above these resistance elements would potentially confirm a bullish rally, with the target being around $3. Until then, this is still a neutral to slightly bearish structure favouring range traders rather than trend-followers.
The BTC Pair
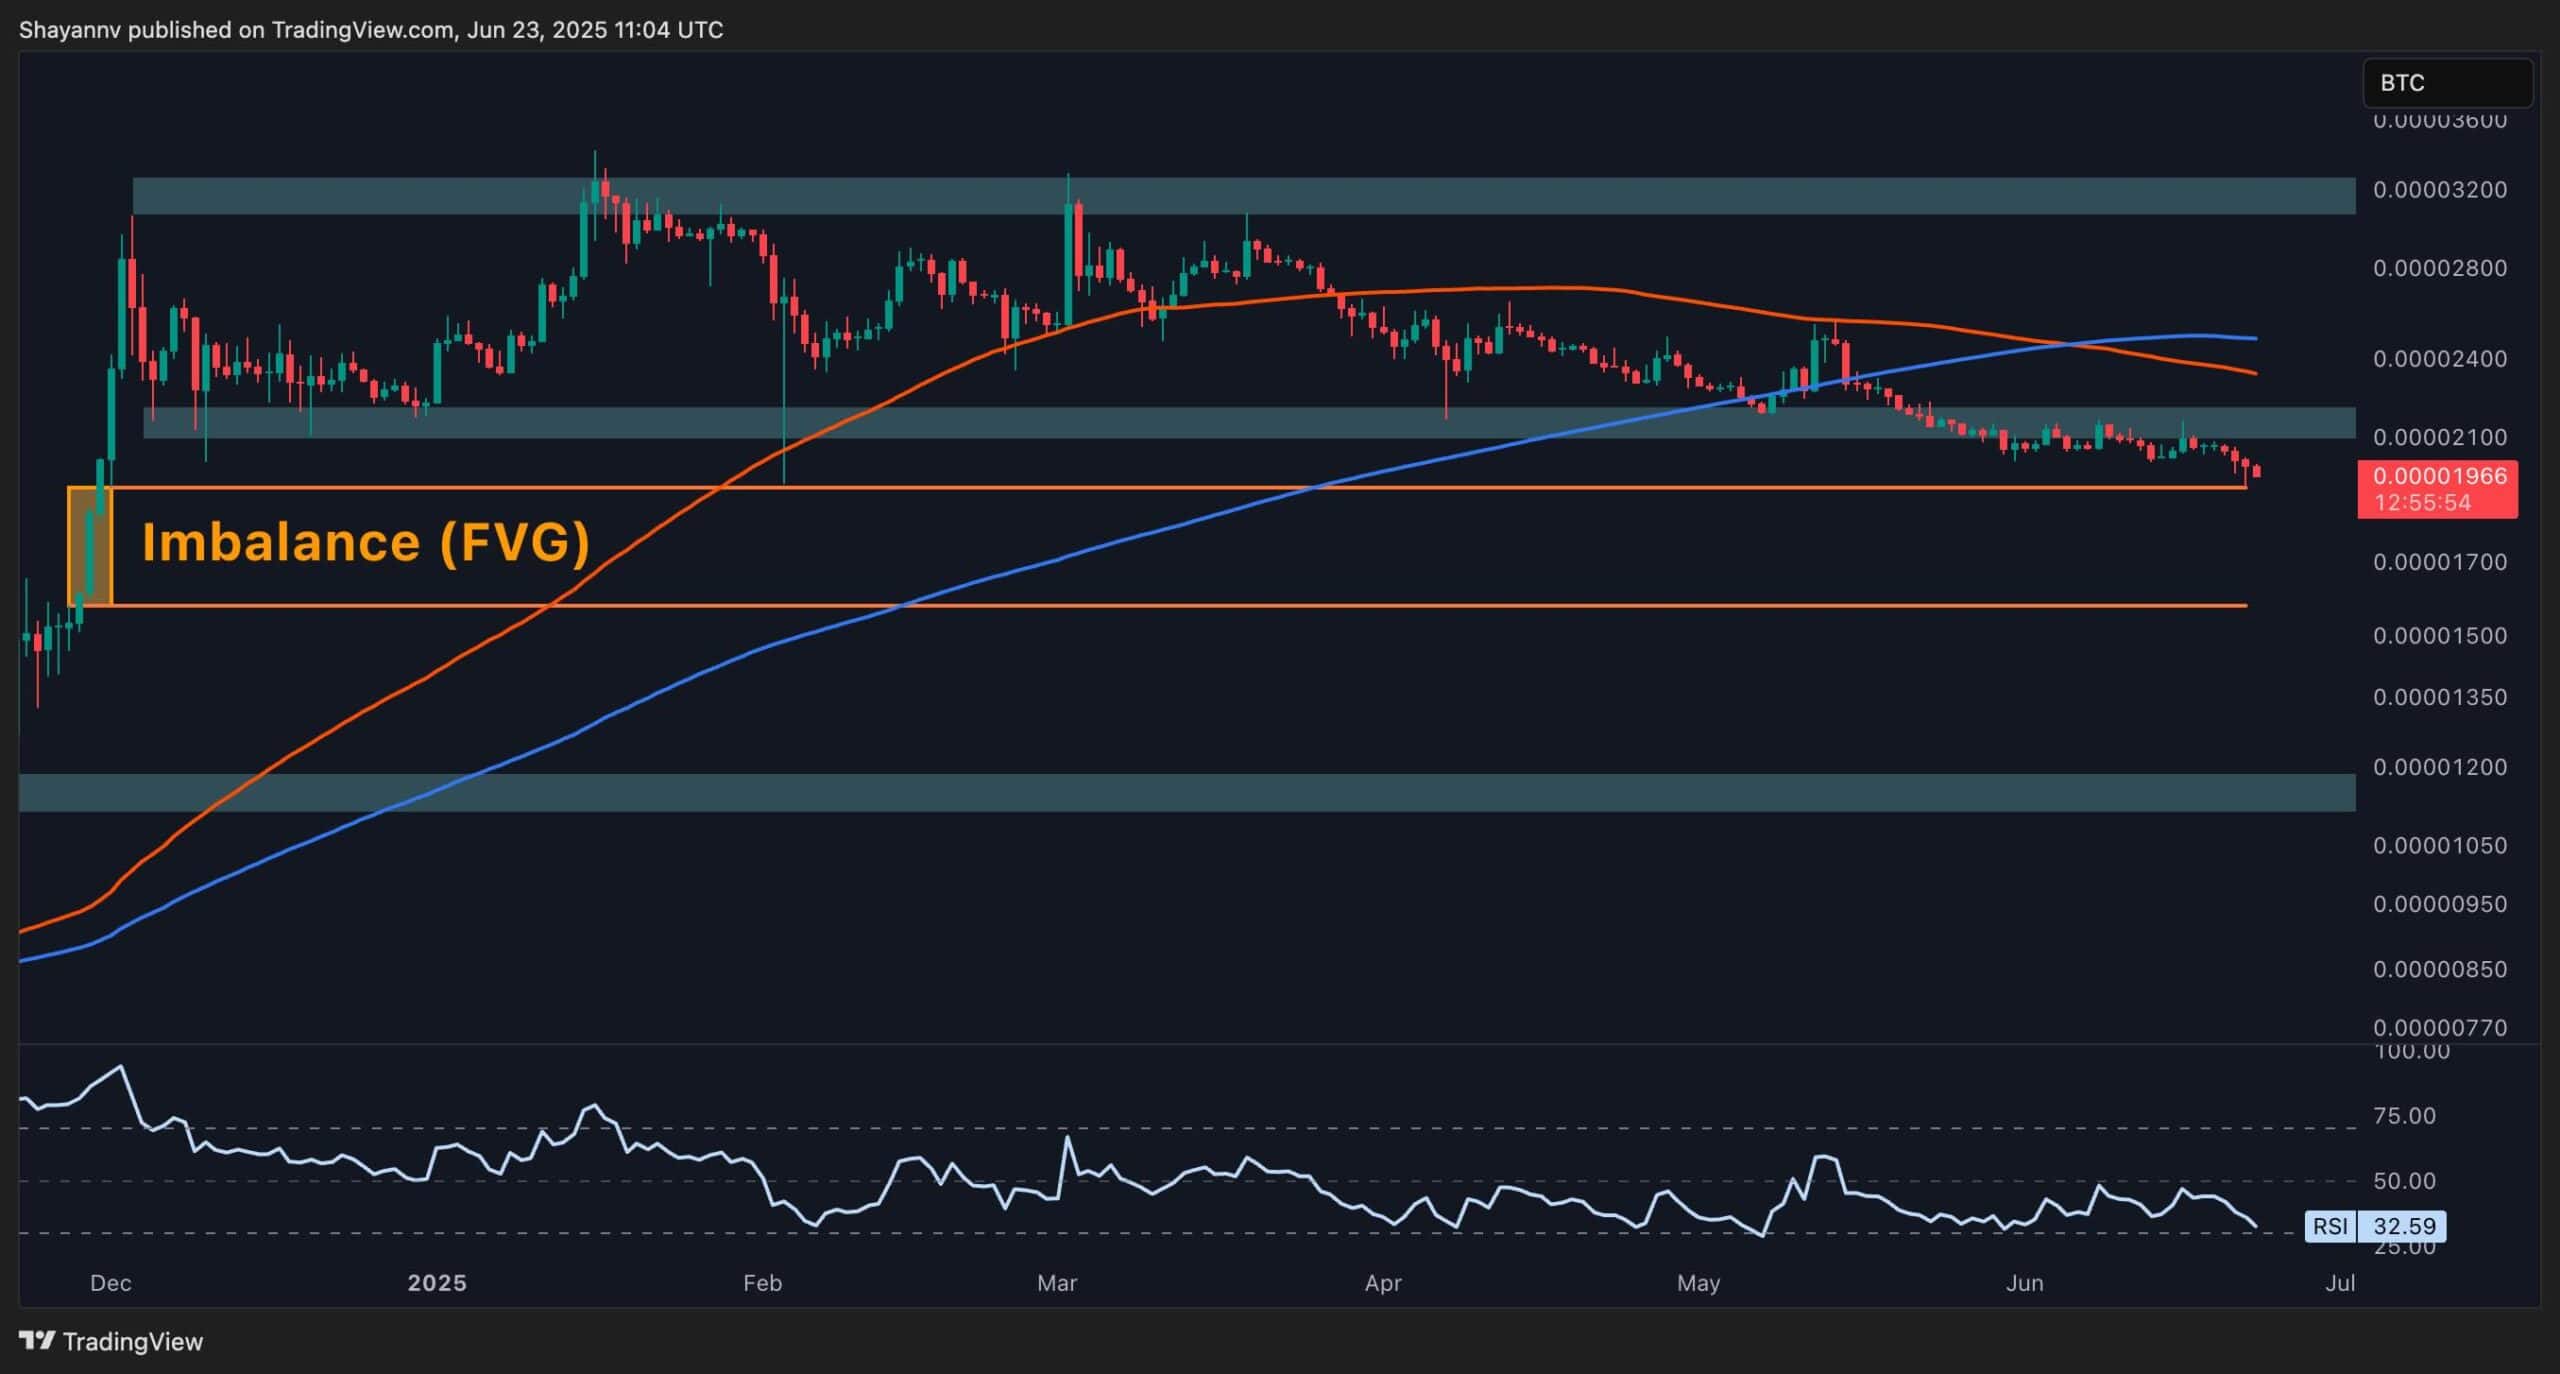
Against Bitcoin, XRP has shown persistent weakness since March, consistently printing lower highs and lower lows. The chart highlights a clear bearish market structure.
Both the 100 and 200 moving averages, located near the 2,400 SAT mark, are angled downward after a bearish crossover, and the RSI is still depressed near 32, reflecting ongoing relative underperformance.
Meanwhile, the pair is approaching the imbalance zone (FVG) left from the explosive rally in late 2024. This pocket, located just below 1900 SAT, could act as a support zone for a potential relief bounce. If the buyers step in here, the first challenge lies near the 2200 SAT resistance level. A decisive move above that area could shift short-term momentum, but unless that happens, the pair remains locked in a clear bearish structure.
The post Ripple Price Analysis: XRP Taps $2 But How Low Can it Go? appeared first on CryptoPotato.
In This News
Coins

$ 62.95K
-2.75%
$ 0.0638
+3.82%
$ 1.06
-2.20%
$ 0.9989
0%
$ 0.00...361


Predictions Markets
See what traders are focused on
Share:
In This News
Coins
$ 62.95K
-2.75%$ 0.0638
+3.82%$ 1.06
-2.20%$ 0.9989
0%$ 0.00...361
Predictions Markets
See what traders are focused on
Share:
Read More

SBI, Ripple yatırımının değerini 6,6 trilyon yen olarak açıkladı