XRP Buy Signal Goes Off, Analyst Says This Is How Long Uptrend Will Last
Share:
Predictions Markets
See what traders are focused on

An analyst has recently explained how a buy signal has formed for XRP on its weekly chart, which could lead to an uptrend lasting for this long.
XRP Has Observed A TD Sequential Buy Signal Recently
In a new post on X, analyst Ali discussed a buy signal forming in the weekly price of XRP. The relevant indicator is the “Tom Demark (TD) Sequential,” a technical analysis tool for pinpointing probable reversal points for any asset’s price.
This indicator is made up of two phases. The first phase is called the “setup” and lasts nine candles. During this phase, candles of the same polarity are counted up to nine, and following the ninth candle, the commodity can be assumed to have hit a top or bottom.
If the setup’s completion occurred with nine green candles (the prevailing trend was bullish), then the indicator would suggest a switch toward the bearish direction. Similarly, red candles would imply a buy signal for the asset.
The second phase in the TD Sequential is the “countdown,” which works just like the setup except that it lasts for thirteen candles. After these thirteen candles, another price reversal may have occurred.
The TD Sequential phase of the former type has been completed for XRP recently. Here is the chart shared by the analyst that shows the TD Sequential setup forming in the weekly price of the cryptocurrency:
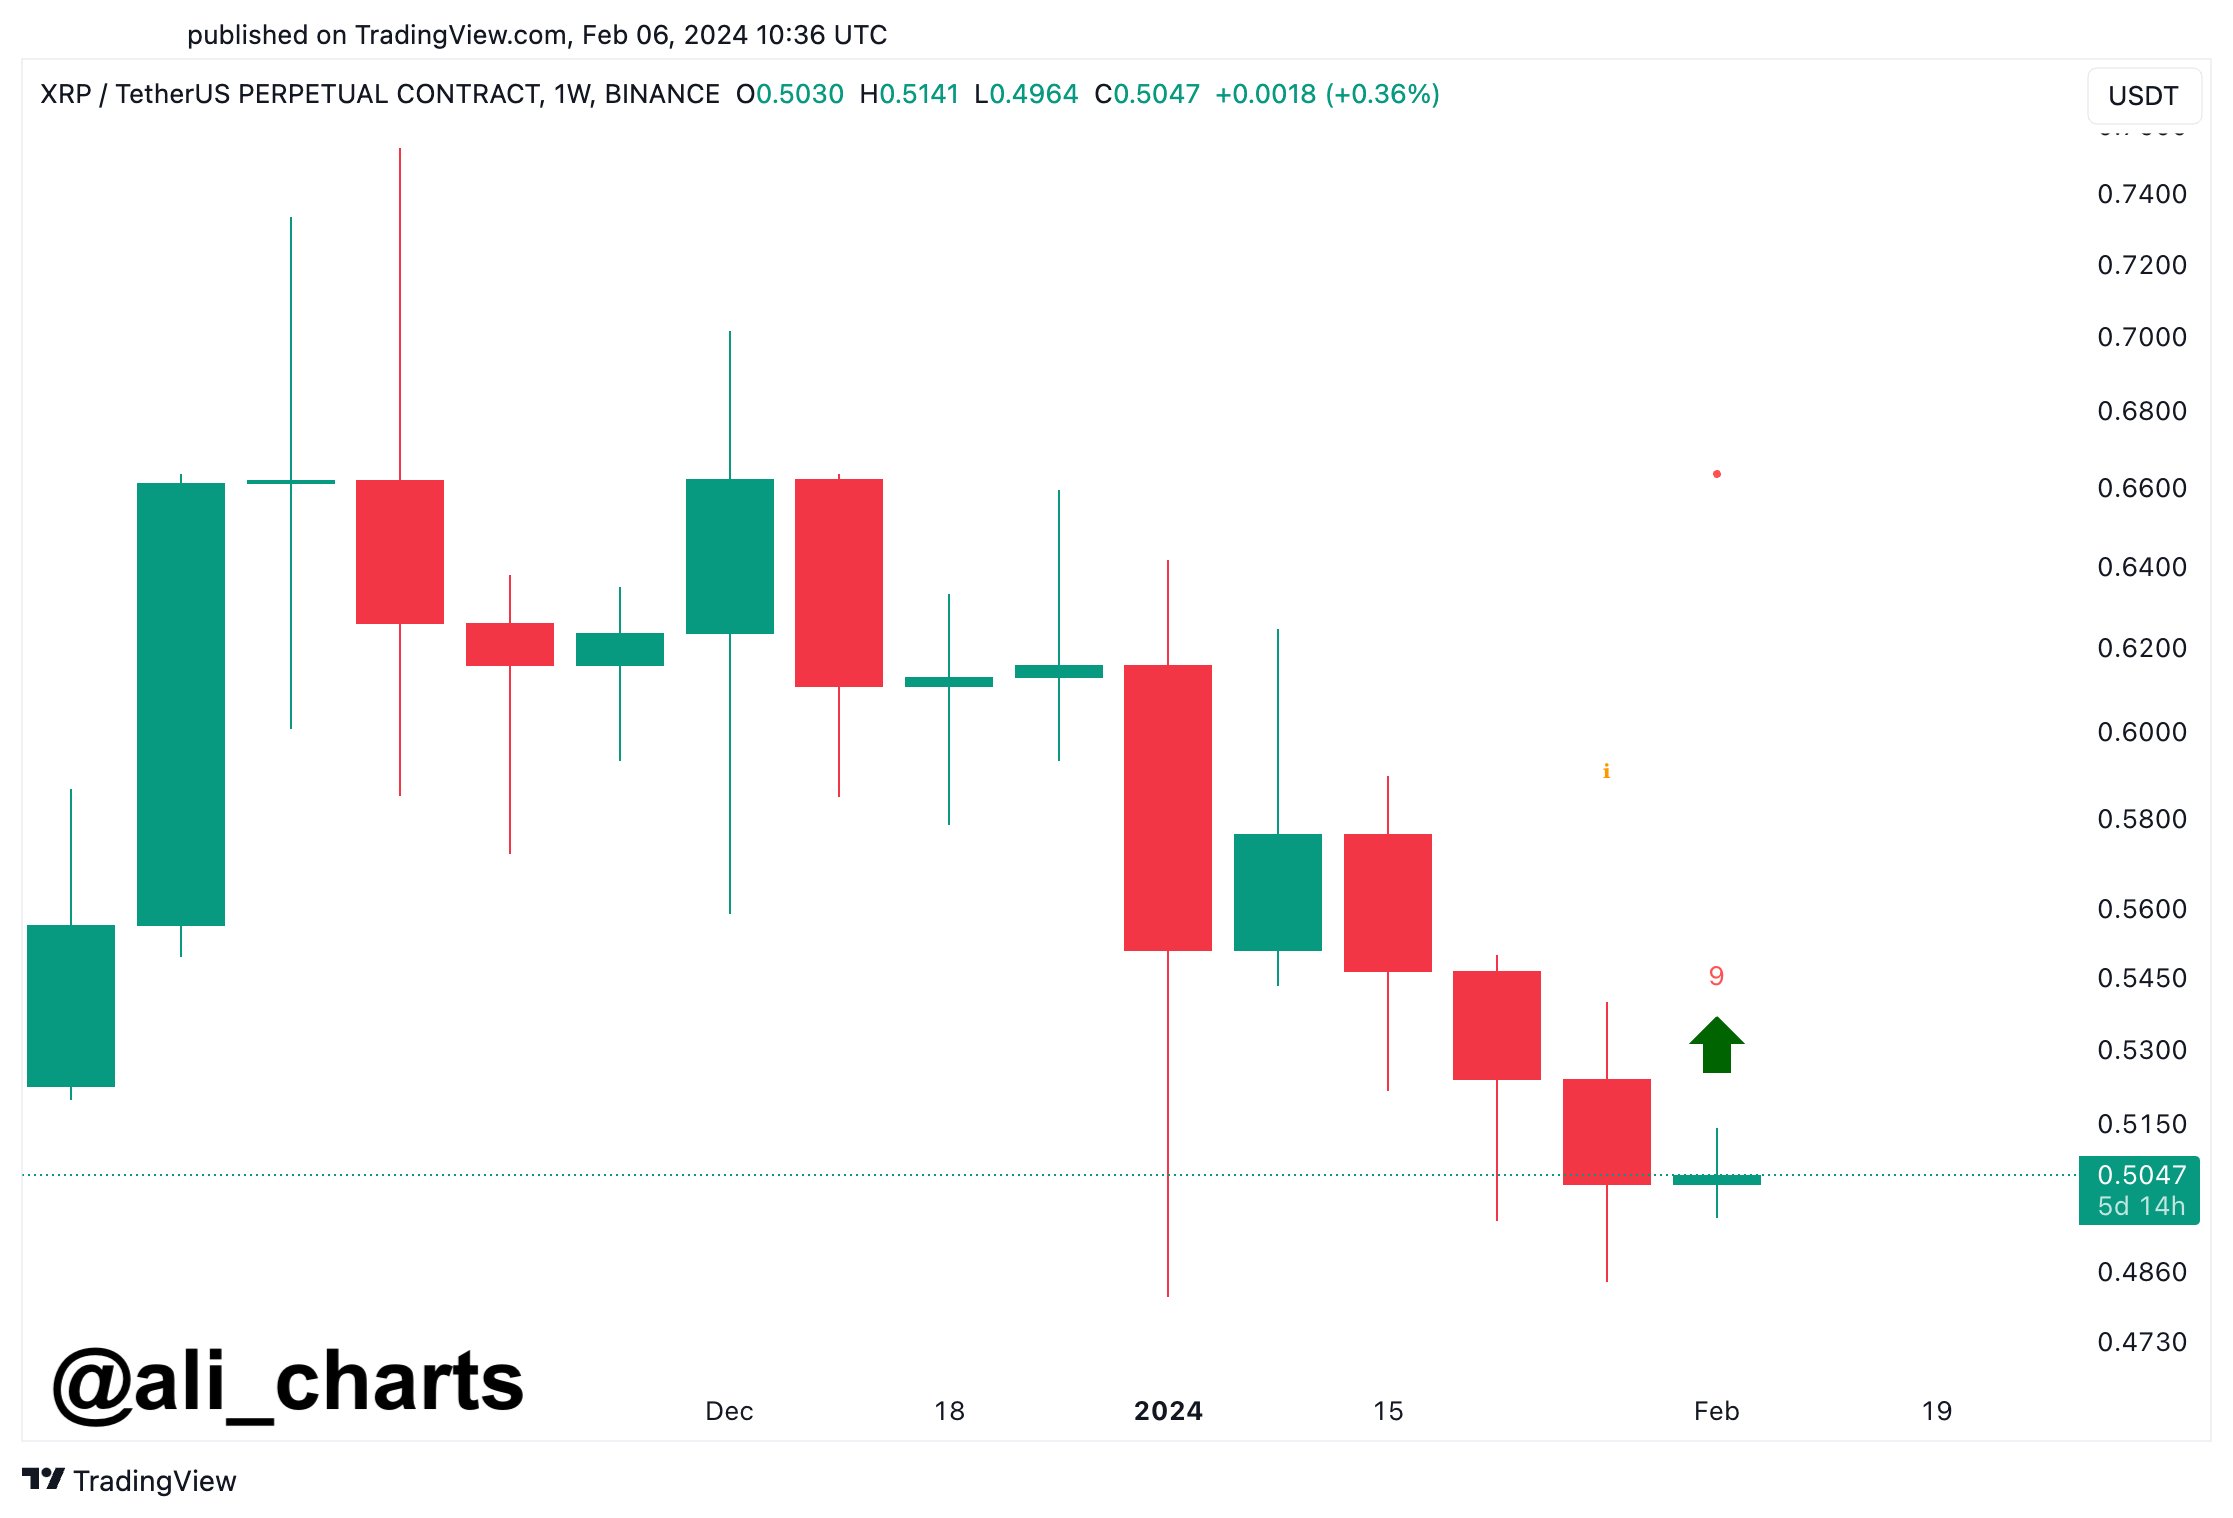
The graph shows that this TD Sequential setup in the cryptocurrency’s 7-day price has formed with red candles, as the coin’s price has been struggling recently.
The historical pattern could imply that the asset may have now hit a probable bottom point. Ali suggests XRP “is poised for an upswing lasting one to four weeks.”
XRP Has Continued To Go Down Since The Year Has Kicked Off
The year 2024 began for XRP with a sharp move down, from which the asset still hasn’t been able to recover as its price has continued to head downward, staying in line with the tone set by the poor start.
The below chart shows how the coin has performed over the last three months.
A brief relief rally came for XRP around the time of the Bitcoin spot ETF approval, but just like it had played out in the broader sector, this surge also couldn’t last long as investors took to selling the news.
After all the downtrend since then, the cryptocurrency is now trading around the $0.50 mark, down almost 18% year-to-date.
In This News
Coins

$ 64.21K
+0.53%
$ 1.11
+1.02%
$ 0.0751
+1.57%
$ 8.07
+1.75%
$ 0.000603


Predictions Markets
See what traders are focused on
Share:
In This News
Coins
$ 64.21K
+0.53%$ 1.11
+1.02%$ 0.0751
+1.57%$ 8.07
+1.75%$ 0.000603
Predictions Markets
See what traders are focused on
Share:
Read More
Analyst Predicts XRP Could Surge To $17, Challenge Ethereum in Next Bull Run