Top 100 Coins
Trending Cryptos
Performance
Recently Listed
Gainers
All Categories
All Time High
Blockchains
Global Market Data
Ecosystems
Research
Rewards
Heatmaps
Drop Hunting
Alerts
Converter
Widgets
Market Data API
Futures and Options
Affiliate Program
XRP Price Bearish Continuation Confirmed As Downside Pressure Builds
Share:
XRP price has declined below $1.90, forming a bearish trend with resistance at $1.885. A failure to rise above $1.90 could lead to further losses, potentially testing support levels around $1.840 and $1.820.
XRP price extended losses and traded below $1.880. The price is now consolidating and might decline further if it remains below $1.920.
- XRP price started a fresh decline below the $1.90 zone.
- The price is now trading below $1.90 and the 100-hourly Simple Moving Average.
- There is a key bearish trend line forming with resistance at $1.885 on the hourly chart of the XRP/USD pair (data source from Kraken).
- The pair could continue to move down if it stays below $1.90.
XRP Price Dips Further
XRP price failed to stay above $1.950 and started a fresh decline, like Bitcoin and Ethereum. The price declined below $1.920 and $1.90 to enter a short-term bearish zone.
The price even spiked below $1.850. A low was formed at $1.810, and the price is now consolidating losses. There was a recovery wave above $1.850. The price cleared the 23.6% Fib retracement level of the downward move from the $1.963 swing high to the $1.810 low, but the bears remained active.
The price is now trading below $1.90 and the 100-hourly Simple Moving Average. If there is a fresh upward move, the price might face resistance near the $1.8850 level and the 50% Fib retracement level of the downward move from the $1.963 swing high to the $1.810 low. There is also a key bearish trend line forming with resistance at $1.885 on the hourly chart of the XRP/USD pair.
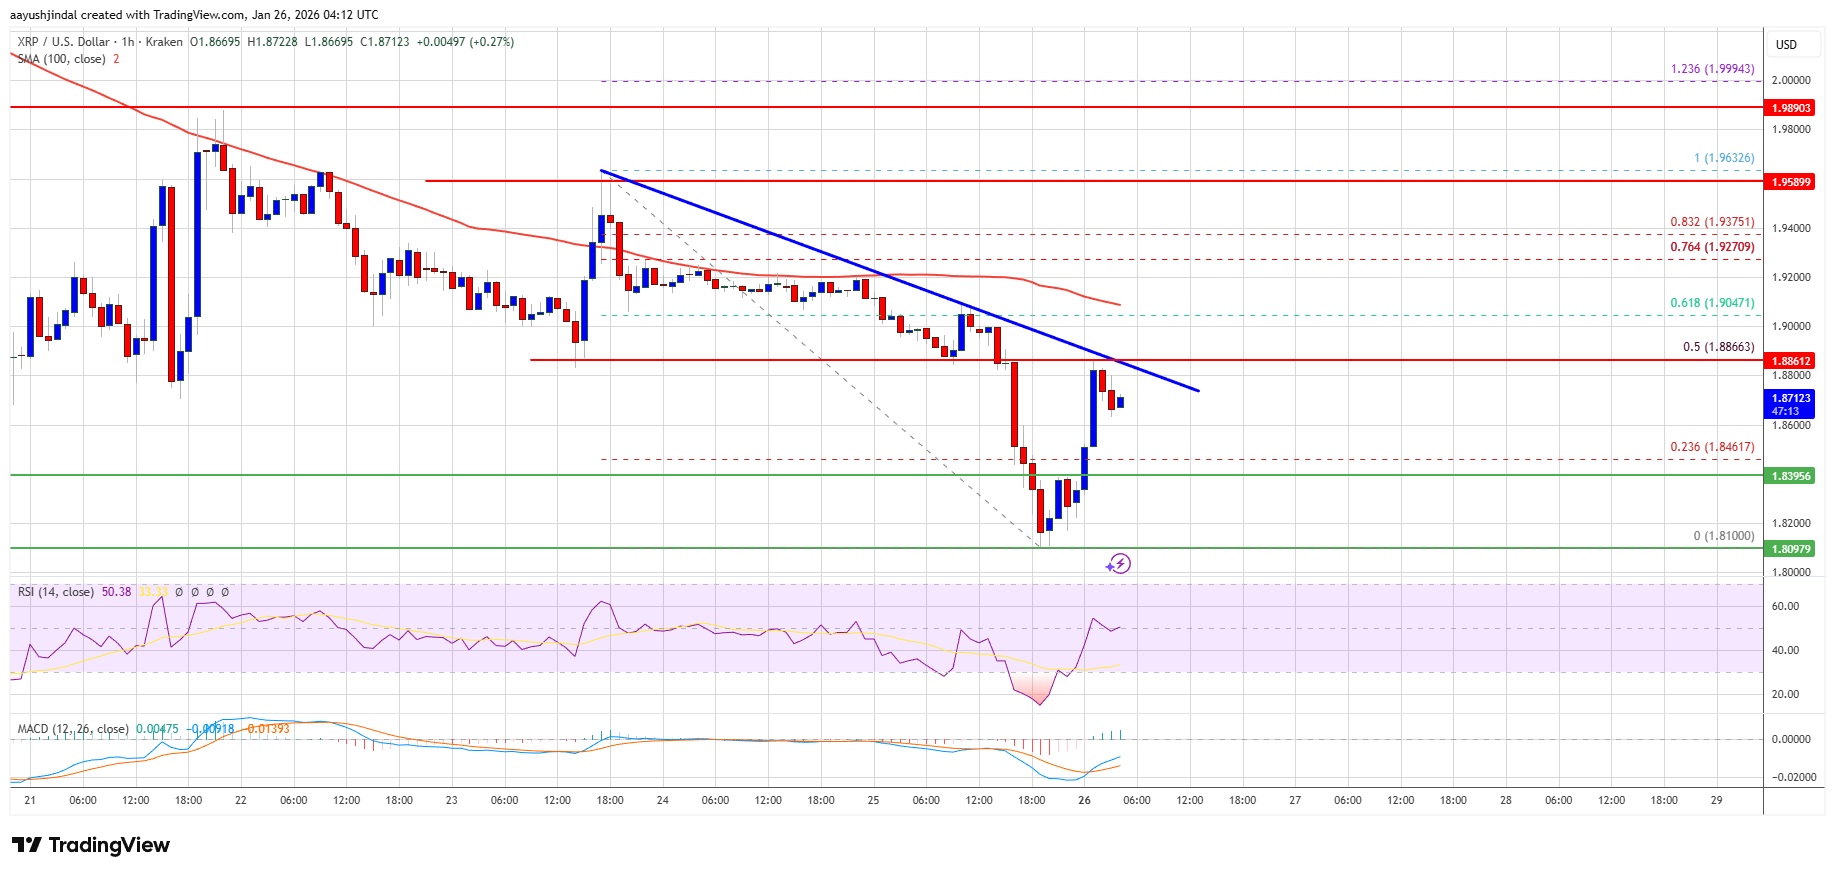
The first major resistance is near the $1.90 level. A close above $1.90 could send the price to $1.950. The next hurdle sits at $2.00. A clear move above the $2.00 resistance might send the price toward the $2.050 resistance. Any more gains might send the price toward the $2.120 resistance. The next major hurdle for the bulls might be near $2.20.
Downside Break?
If XRP fails to clear the $1.90 resistance zone, it could start a fresh decline. Initial support on the downside is near the $1.840 level. The next major support is near the $1.820 level.
If there is a downside break and a close below the $1.820 level, the price might continue to decline toward $1.780. The next major support sits near the $1.750 zone, below which the price could continue lower toward $1.70.
Technical Indicators
Hourly MACD – The MACD for XRP/USD is now gaining pace in the bearish zone.
Hourly RSI (Relative Strength Index) – The RSI for XRP/USD is now near the 50 level.
Major Support Levels – $1.840 and $1.820.
Major Resistance Levels – $1.8850 and $1.90.
In This News


Share:
In This News
Share:
Read More

Ethereum Price Sinks To $2,800, Raising Fresh Downside Fears

Crypto Price Prediction Today 23 January – XRP, Bitcoin, Ethereum
XRP Price Bearish Continuation Confirmed As Downside Pressure Builds
Share:
XRP price has declined below $1.90, forming a bearish trend with resistance at $1.885. A failure to rise above $1.90 could lead to further losses, potentially testing support levels around $1.840 and $1.820.
XRP price extended losses and traded below $1.880. The price is now consolidating and might decline further if it remains below $1.920.
- XRP price started a fresh decline below the $1.90 zone.
- The price is now trading below $1.90 and the 100-hourly Simple Moving Average.
- There is a key bearish trend line forming with resistance at $1.885 on the hourly chart of the XRP/USD pair (data source from Kraken).
- The pair could continue to move down if it stays below $1.90.
XRP Price Dips Further
XRP price failed to stay above $1.950 and started a fresh decline, like Bitcoin and Ethereum. The price declined below $1.920 and $1.90 to enter a short-term bearish zone.
The price even spiked below $1.850. A low was formed at $1.810, and the price is now consolidating losses. There was a recovery wave above $1.850. The price cleared the 23.6% Fib retracement level of the downward move from the $1.963 swing high to the $1.810 low, but the bears remained active.
The price is now trading below $1.90 and the 100-hourly Simple Moving Average. If there is a fresh upward move, the price might face resistance near the $1.8850 level and the 50% Fib retracement level of the downward move from the $1.963 swing high to the $1.810 low. There is also a key bearish trend line forming with resistance at $1.885 on the hourly chart of the XRP/USD pair.
The first major resistance is near the $1.90 level. A close above $1.90 could send the price to $1.950. The next hurdle sits at $2.00. A clear move above the $2.00 resistance might send the price toward the $2.050 resistance. Any more gains might send the price toward the $2.120 resistance. The next major hurdle for the bulls might be near $2.20.
Downside Break?
If XRP fails to clear the $1.90 resistance zone, it could start a fresh decline. Initial support on the downside is near the $1.840 level. The next major support is near the $1.820 level.
If there is a downside break and a close below the $1.820 level, the price might continue to decline toward $1.780. The next major support sits near the $1.750 zone, below which the price could continue lower toward $1.70.
Technical Indicators
Hourly MACD – The MACD for XRP/USD is now gaining pace in the bearish zone.
Hourly RSI (Relative Strength Index) – The RSI for XRP/USD is now near the 50 level.
Major Support Levels – $1.840 and $1.820.
Major Resistance Levels – $1.8850 and $1.90.
In This News
Share:
In This News
Share:
Read More
Ethereum Price Sinks To $2,800, Raising Fresh Downside Fears