Solana (SOL) Rebound Faces Major Test Near Key Resistance Zone

Share:
Solana (SOL) staged a recovery from the $83.50 support and is trading above $86 and the 100‑hour SMA, but faces immediate resistance at $88.50 with upside targets at $90, $92 and $94. If SOL fails to clear $88.50 downside support sits at $86.20, $85 and $83.50 with risk to $80; hourly MACD is losing bearish pace while RSI remains above 50, signaling cautious bullish token performance in the crypto market.
Predictions Markets
See what traders are focused on

Solana found support at $83.50 and corrected some losses. SOL price is now consolidating below $88.50 and might struggle to continue higher.
- SOL price started a decent recovery wave above $85 and $86 against the US Dollar.
- The price is now trading above $86 and the 100-hourly simple moving average.
- There is a rising channel forming with resistance at $88.50 on the hourly chart of the SOL/USD pair (data source from Kraken).
- The price could continue to move up if it clears $88.50 and $90.00.
Solana Price Starts Recovery
Solana price remained stable and started a decent recovery wave from $83.50, like Bitcoin and Ethereum. SOL was able to climb above the $85 level.
There was a move above the 38.2% Fib retracement level of the downward move from the $93.63 swing high to the $83.35 low. However, the bears remained active below $88. There is also a rising channel forming with resistance at $88.50 on the hourly chart of the SOL/USD pair.
Solana is now trading above $86 and the 100-hourly simple moving average. On the upside, immediate resistance is near the $88.00 level. The next major resistance is near the $88.50 level or the 50% Fib retracement level of the downward move from the $93.63 swing high to the $83.35 low.
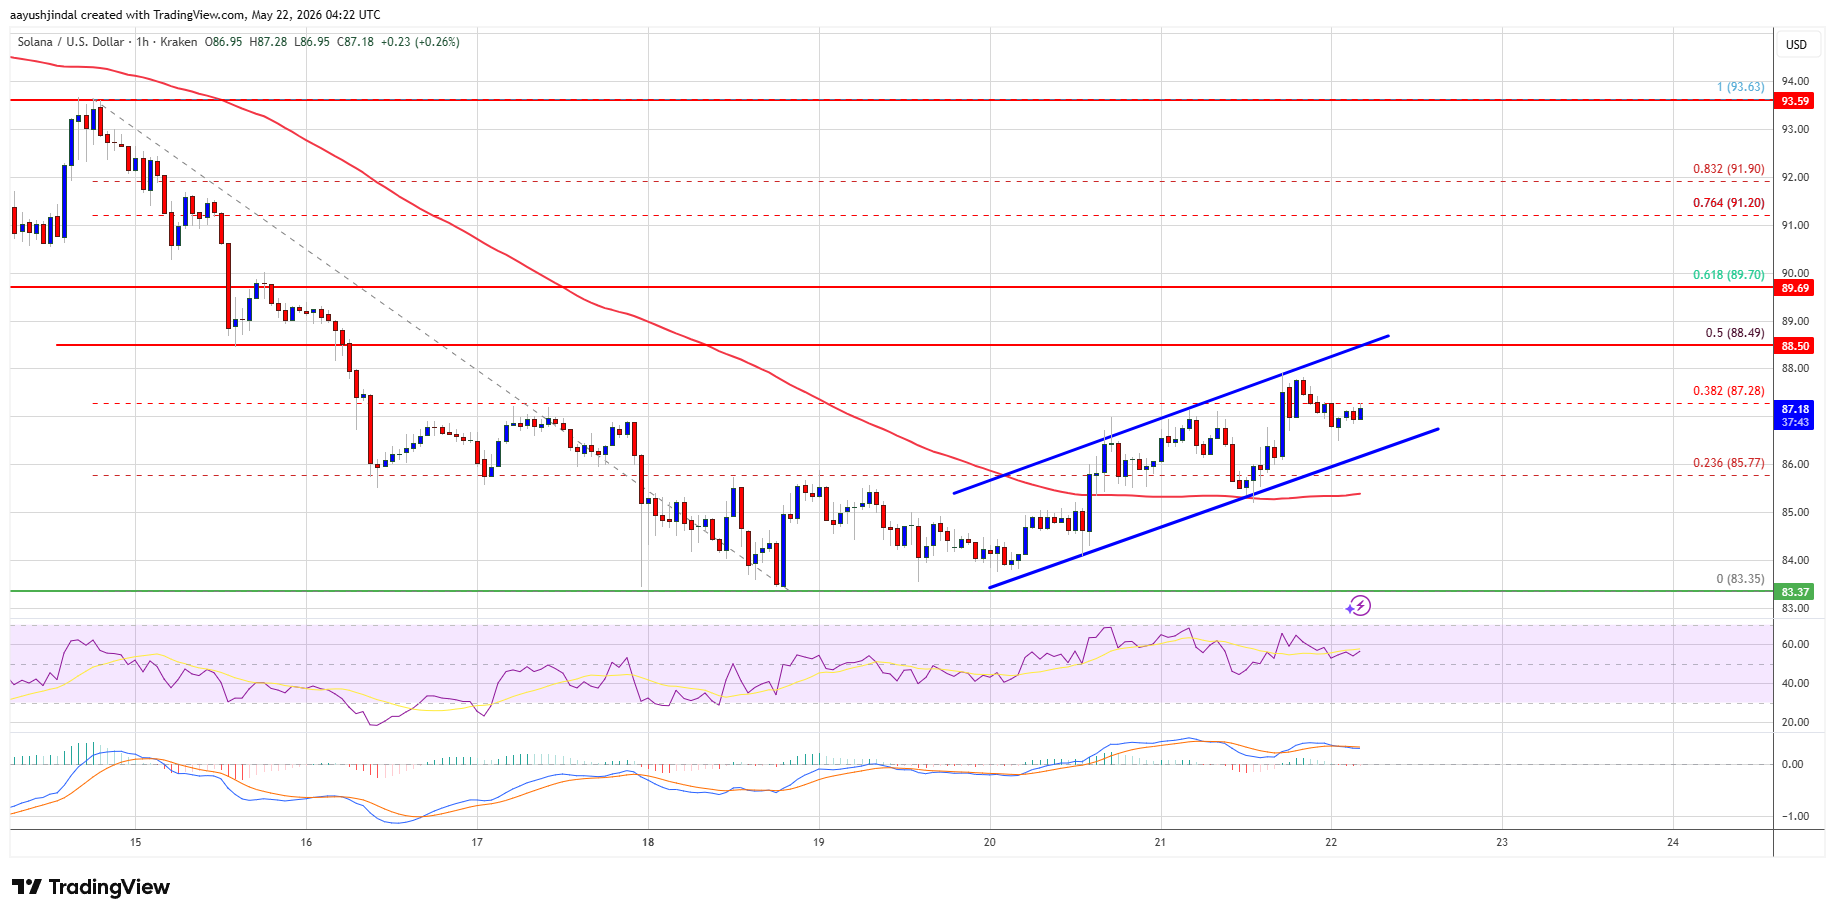
The main resistance could be $90. A successful close above the $90 resistance zone could set the pace for another steady increase. The next key resistance is $92. Any more gains might send the price toward the $94 level.
Another Decline In SOL?
If SOL fails to rise above the $88.50 resistance, it could continue to move down. Initial support on the downside is near the $86.20 zone. The first major support is near the $85.00 level.
A break below the $85.00 level might send the price toward the $83.50 support zone. If there is a close below the $83.50 support, the price could decline toward the $80 zone in the near term.
Technical Indicators
Hourly MACD – The MACD for SOL/USD is losing pace in the bearish zone.
Hourly Hours RSI (Relative Strength Index) – The RSI for SOL/USD is above the 50 level.
Major Support Levels – $86.200 and $85.00.
Major Resistance Levels – $88.50 and $90.00.


Read More

Solana (SOL) Hits a Key Decision Zone: Can Buyers Reverse the 5% Slide?