Solana Falls Under Realized Price: Here’s What Happened Last Time

Share:
Predictions Markets
See what traders are focused on

On-chain data shows Solana (SOL) has seen its spot value drop under the Realized Price for the first time in three years following the recent bearish action.
Solana Has Just Seen A Breakdown Of The Realized Price
According to data from the on-chain analytics firm Glassnode, Solana has slipped around 8% below its Realized Price. The “Realized Price” is an indicator that basically tells us about the cost basis of the average investor or address on a given network.
When the spot price of the asset is trading above this metric, it means the holders as a whole are carrying a net unrealized profit. On the other hand, it being under the indicator suggests the average investor is underwater.
Now, here is the chart shared by the analytics firm that shows the trend in the Realized Price for Solana over the last few years:
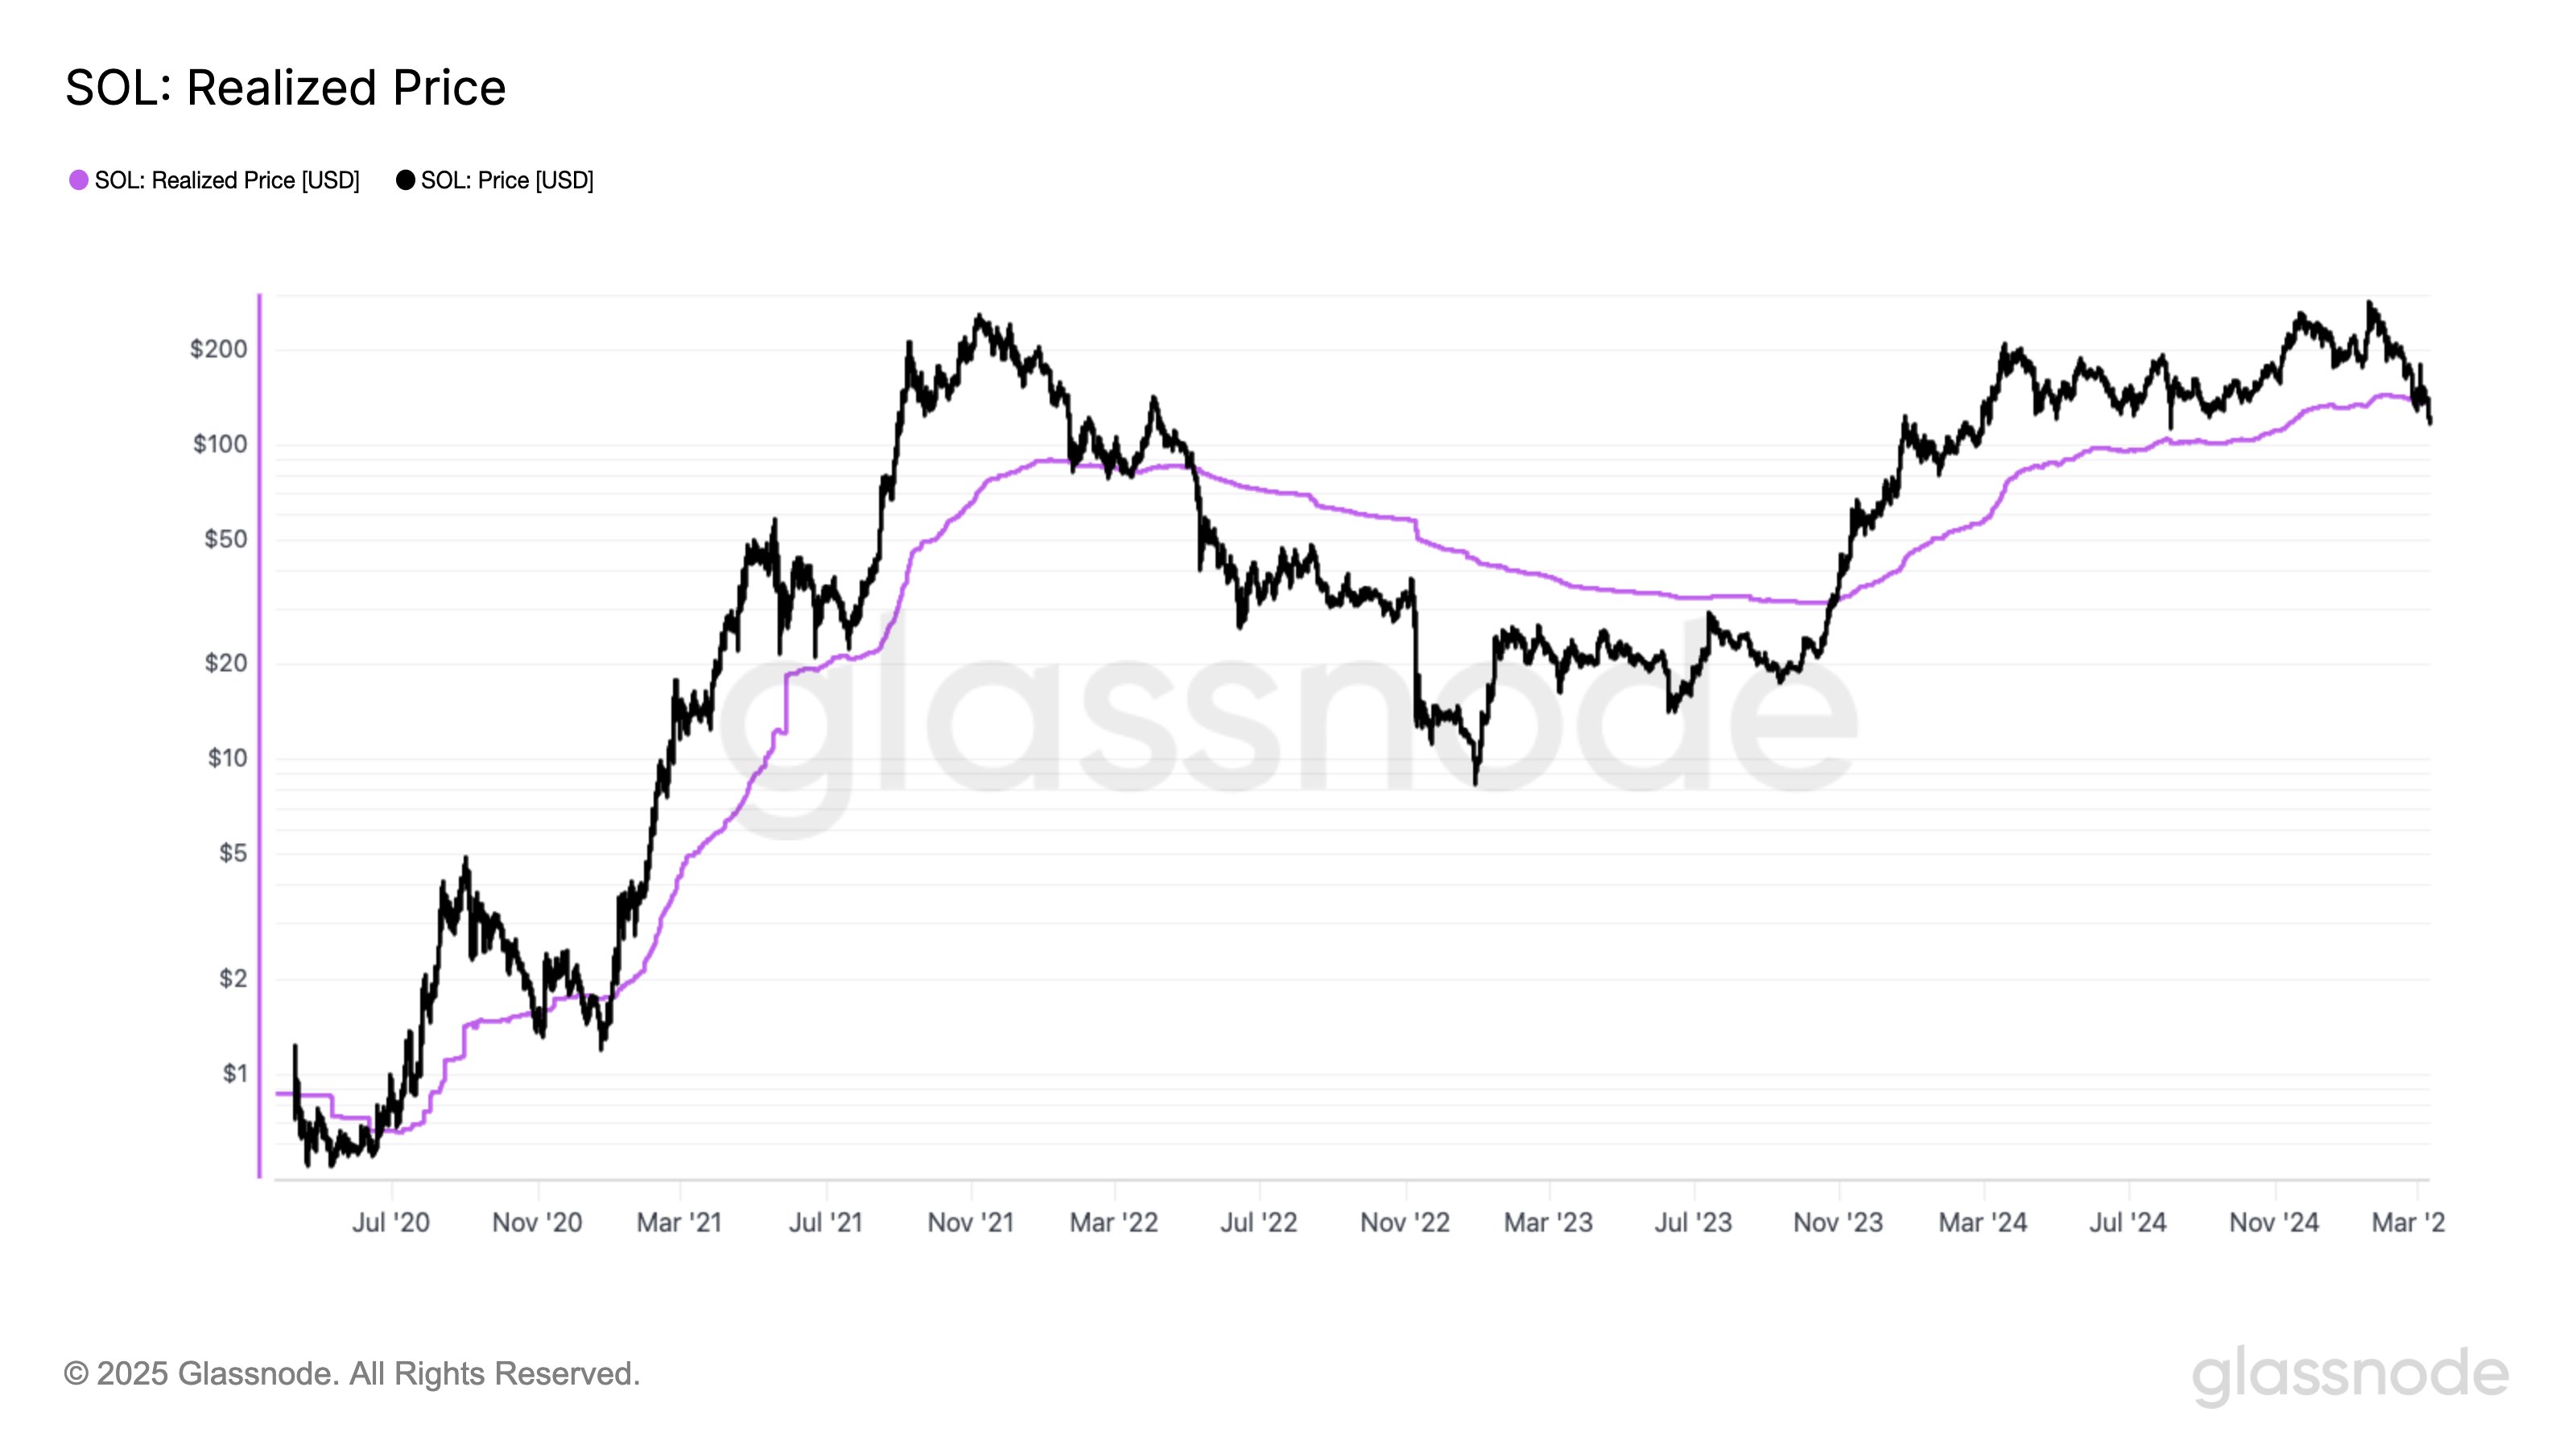
As is visible in the above graph, SOL broke above its Realized Price back in 2023, putting investors into the green. Throughout 2024 and the first couple of months of this year, the price remained above the line, but recently, it seems another crossover has finally occurred.
“Solana just plunged below its Realized Price for the first time in nearly 3 years,” notes Glassnode. At the current exchange rate, the price is around 8% below this metric, which means the average holder of the asset could be assumed to be 8% in the red.
From the chart, it’s apparent that the last time the cryptocurrency saw this type of crossover was back in 2022. Losing the level then meant the start of a bear market. Thus, it’s possible that the latest breakdown of the line could prove to be a bad sign for the coin this time as well.
Historically, the Realized Price has played the role of a boundary between bear and bull trends for not just SOL, but also other digital assets. In another X post, Glassnode has shared the data for a version of the indicator for Bitcoin, the number one cryptocurrency.
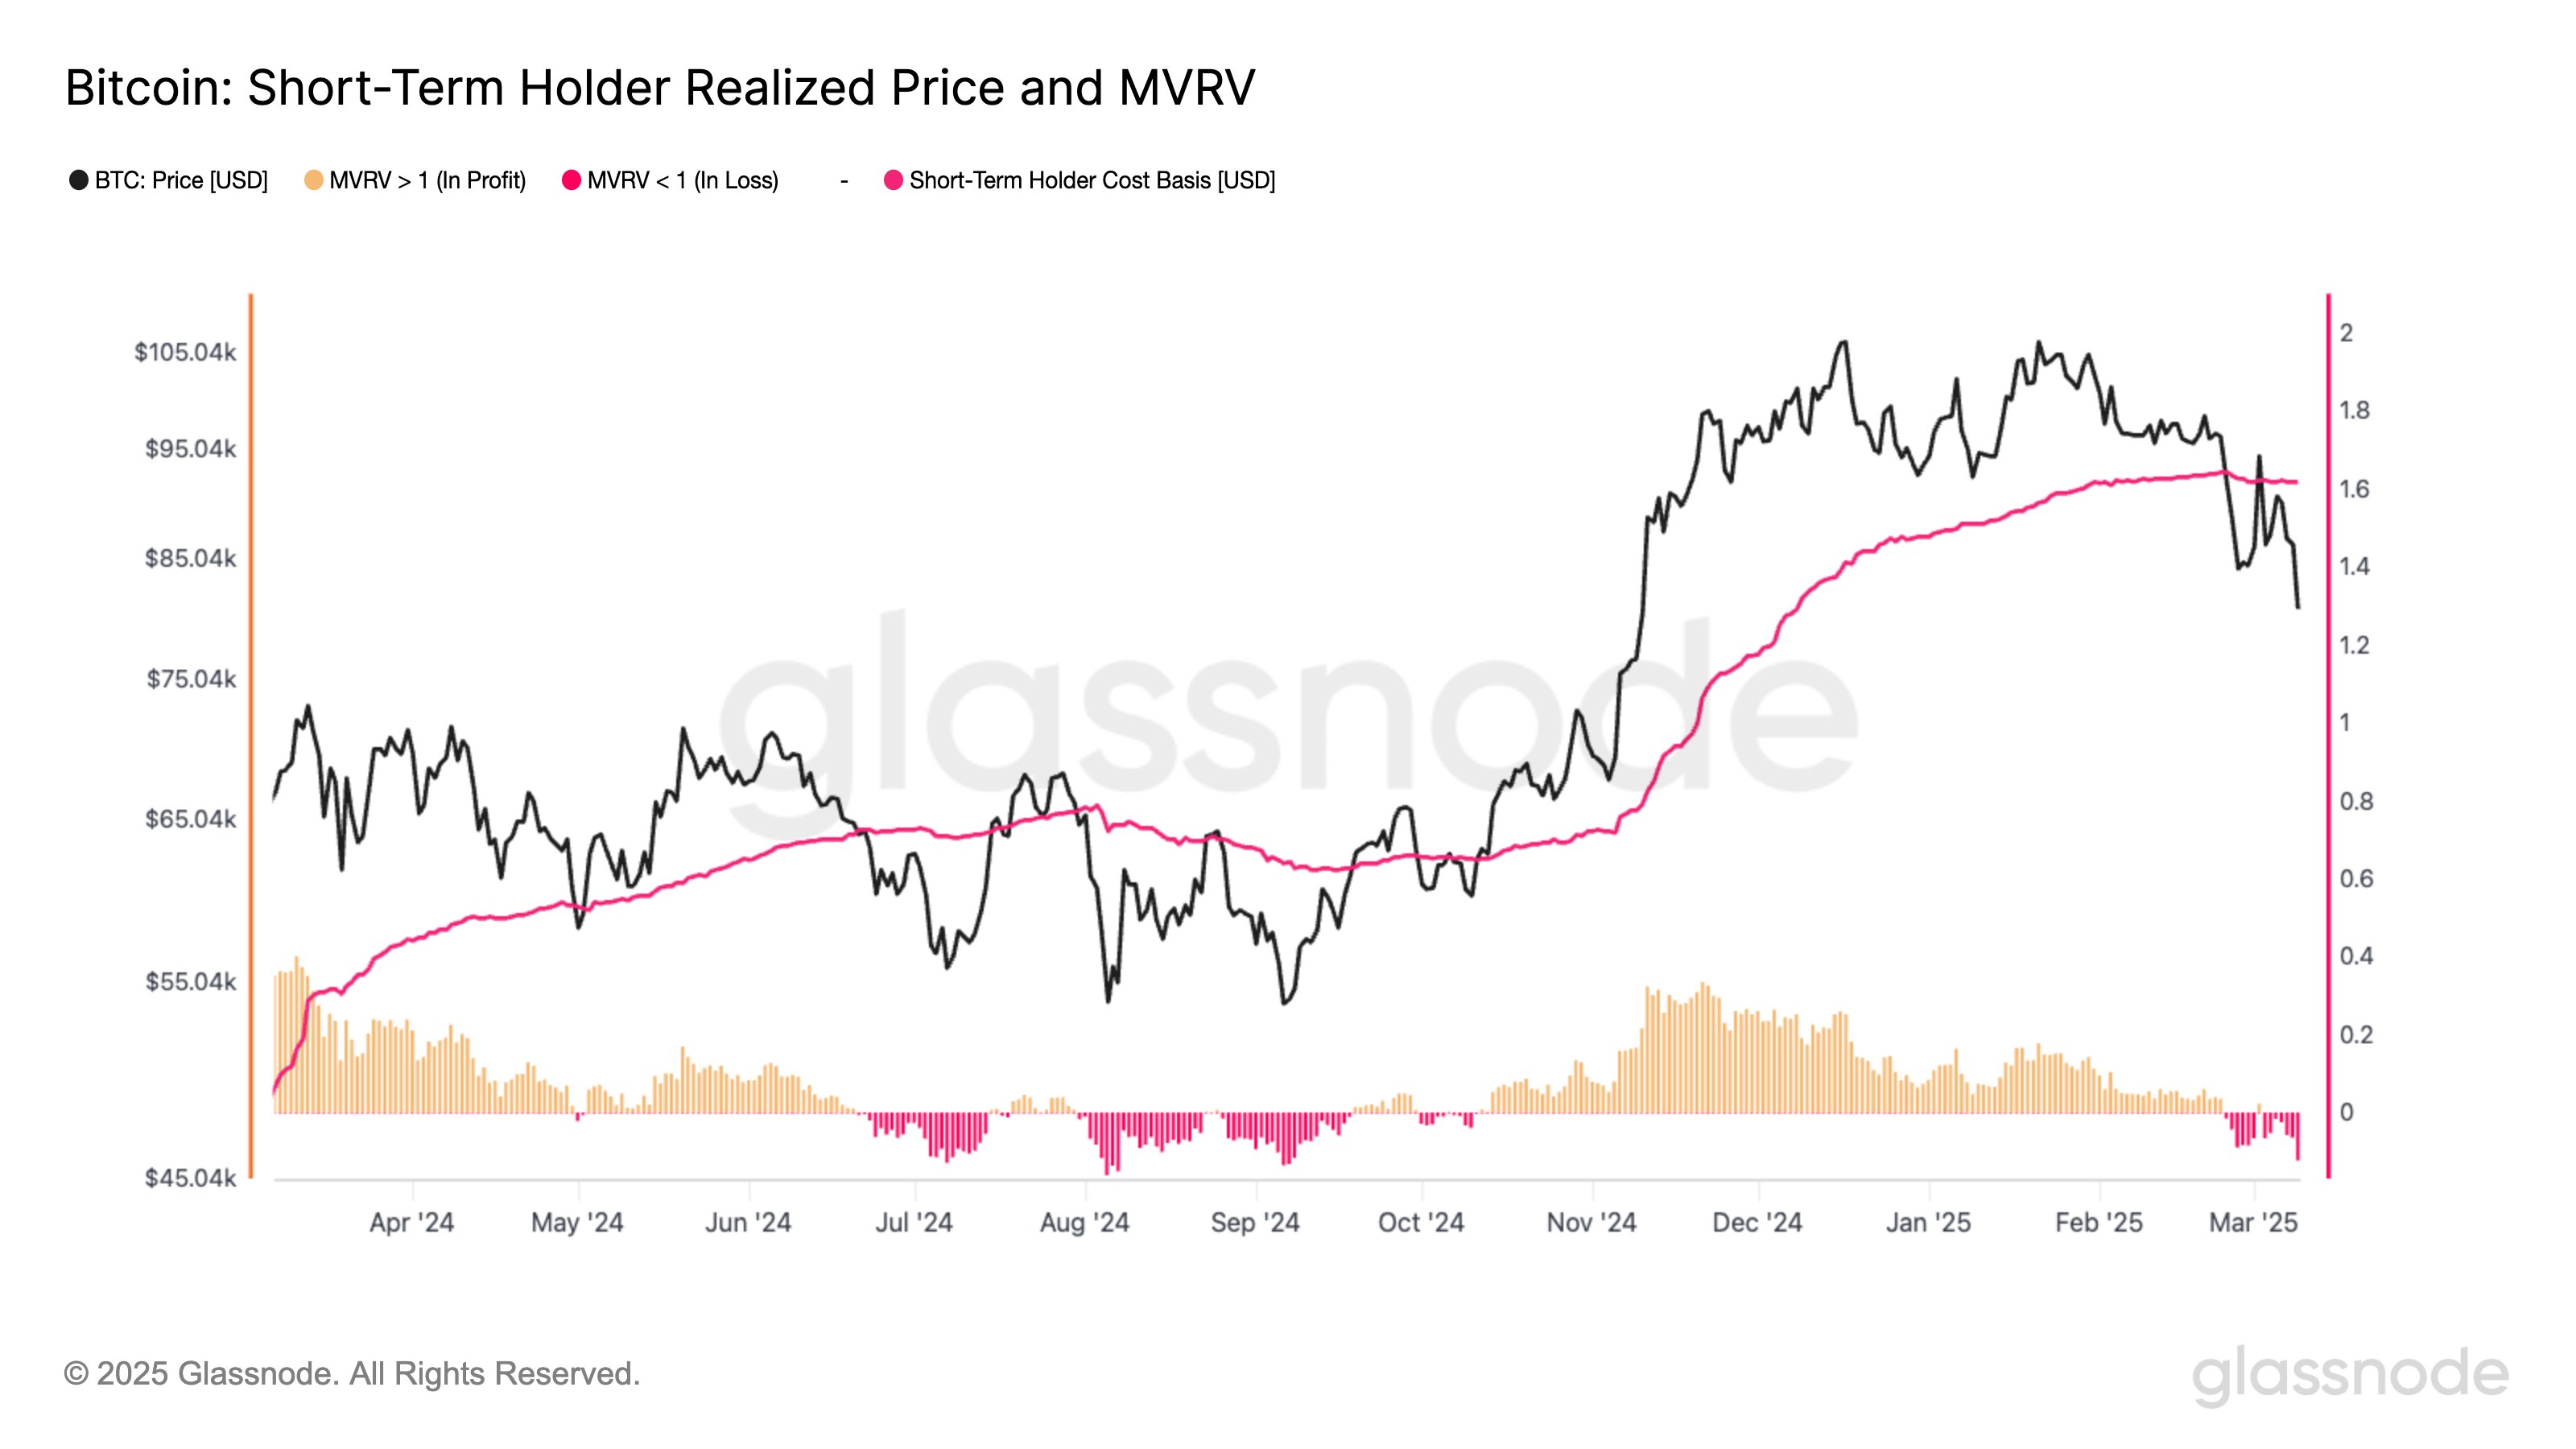
The metric displayed in the chart is the Realized Price of the short-term holders, which only measures the average cost basis of the investors who purchased their coins within the past 155 days. Unlike the Realized Price of the entire network, this version of the indicator serves more like a boundary line for short-term momentum shifts.
After the recent bearish price action across the digital asset sector, Bitcoin has seen its short-term holders fall into the red, which could imply the asset may continue to suffer from a drawdown in the near future.
SOL Price
At the time of writing, Solana is trading around $124, down almost 9% in the last week.
In This News
Coins

$ 64.15K
+0.32%
$ 0.0071
-1.91%
$ 0.0744
+0.54%
$ 0.00...361

$ 0.00132


Predictions Markets
See what traders are focused on
Share:
In This News
Coins
$ 64.15K
+0.32%$ 0.0071
-1.91%$ 0.0744
+0.54%$ 0.00...361
$ 0.00132
Predictions Markets
See what traders are focused on
Share:
Read More

Bitcoin, Solana, and Hyperliquid Show Promise for July Upside — Here’s Why