Toncoin (TON) Forms Double Top Pattern, Bearish Or Bullish?

Share:
Predictions Markets
See what traders are focused on

Toncoin serves as the native token of the TON ecosystem and has multiple use cases. The token like other native tokens such as Solana (SOL) and Ethereum (ETH) has been doing well, as it experienced a notable price rise, especially with the launch of Notcoin (NOT) recently.
Based on TON’s past price movements, the token has successfully formed a Double-Top chart pattern, which is typically followed by a price decline. With a 10% decrease in the past day’s trading volume to $152 million the price of TON is indicating a bearish trend.
In the last 24 hours, TON was around -0.39% down with a market capitalization of about $15,52 billion and the price was trading around $6.44. TON, at the moment, is trading above the 1-day Simple Moving Average (SMA), but in the 4-hour time frame, it is trading below the range.
Technical Indicators Point Toward Sustained Downtrend For TON
From the 4-hour time frame, the price of TON is trading below the 100-day simple moving average, which is a clear sign that it might be poised for a bearish movement.
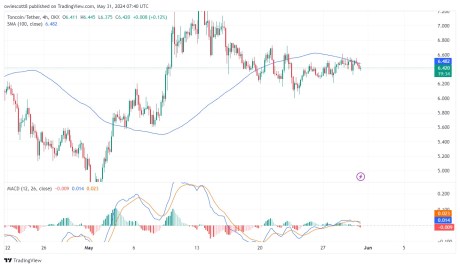
The 4-hour Moving Average Convergence Divergence (MACD) also signals that TON might move bearishly as the MACD histograms are already trending below the MACD zero line. In addition, both the MACD signal line and the MACD line have crossed and are heading towards the MACD zero line of which there is a possibility they might move below it.
On the 1-day time frame, it can also be observed that the price TON is showing signs of going bearish as it is attempting to move toward the 100-day SMA.
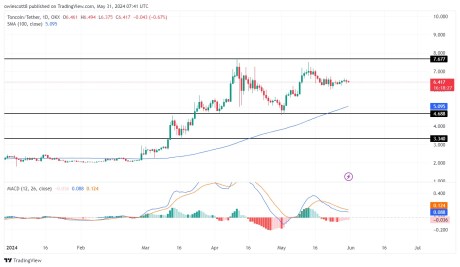
Given that the MACD histograms are trending below the MACD zero line, the 1-day Moving Average Convergence Divergence suggests a possible bearish trend ahead. Both the MACD line and the MACD signal line have crossed and are moving towards the direction of the zero line, as seen in the 4-hour timeframe.
Crucial Points To Determine Next Move
From TON’s previous price action, it can be observed that it has managed to create some highs and lows, which are key points in determining its next destination.
Currently, there is one major resistance level of $7.677 and two major support levels of $4.688 and $3.34. If the price TON continues to move downward and breaks below the support level at the $4.688 mark, it might move even further to test the $3.34 support level.
However, if it fails to break below the $4.688 level, it will continue in its upward trend toward the $7.677 resistance level. Should the price break above this resistance level, it might move even further to create a new high.
In This News
Coins

$ 64.19K
+2.27%
$ 1.79K
+2.72%
$ 0.00...361

$ 0.000207

$ 78.83
+1.22%


Predictions Markets
See what traders are focused on
Share:
In This News
Coins
$ 64.19K
+2.27%$ 1.79K
+2.72%$ 0.00...361
$ 0.000207
$ 78.83
+1.22%Predictions Markets
See what traders are focused on
Share:
Read More

Exodus Trims Bitcoin, Ethereum, and Solana Holdings in June Treasury Update