Bleeding Bitcoin Holders Signal Stress — $60K Becomes Critical Battleground

Share:
Predictions Markets
See what traders are focused on

Bitcoin’s futures market is flashing a warning that analysts say could mean more pain ahead. Open interest climbed to roughly 288,000 BTC even as prices fell, with funding rates holding positive at 0.083% — a sign that bullish bets remain in place despite the selloff, leaving the market exposed to another wave of forced liquidations.
Bitcoin Liquidations Hit Hardest Since February
About $672 million in Bitcoin positions were wiped out in 24 hours ending June 2, the largest single-day wipeout since February 5. That came as Bitcoin slipped below $67,000, dragging short-term holders — those who bought recently — into the red at a pace not seen since early in the year.
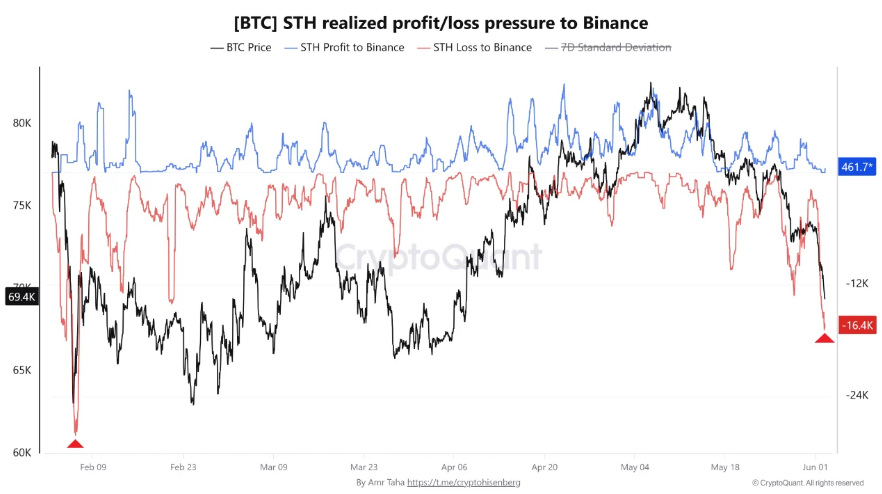
On Binance alone, short-term holder losses hit -16,400 BTC on June 2. Across all exchanges, that figure reached -38,700 BTC, down slightly from -41,300 BTC recorded on May 28. Data shows these are buyers from recent months who are now exiting positions at a loss.
Retail And Mid-Sized Investors Head For The Exits
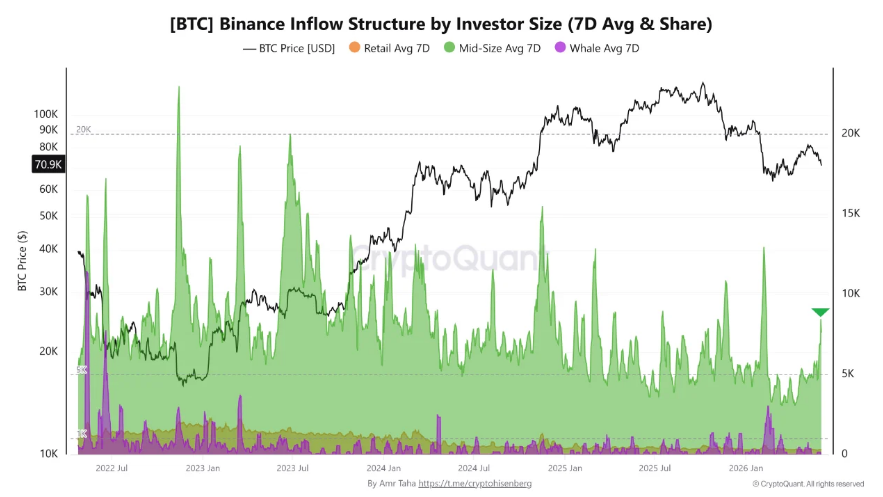
Larger participants are also moving coins. Reports from CryptoQuant analyst Amr Taha show mid-sized investors sent roughly 8,400 BTC to Binance on June 2 alone — the most since February 6. On the retail side, Binance’s 30-day inflow total reached $9.2 billion by June 1, the highest reading since November 20, 2025.
Analyst MorenoDV, who tracked the retail flow data, said exchange inflows don’t automatically mean selling is coming, but they tend to show up before stretches of sharper volatility. If buy-side demand absorbs the inflows, the spike could turn into a local exhaustion point — but if it doesn’t, it may mark the start of broader distribution from weaker hands, MorenoDV said.
$60K Zone Draws All EyesThis is called an expanding triangle. Expanding triangles are very common in Bitcoin. They are also typically reliable. The target for expanding triangles is the height projected from the breakout. A move back above 75,000 would change my analysis $BTC pic.twitter.com/WOOU5xTJ7g
— The Factor Report (@PeterLBrandt) June 2, 2026
From a technical standpoint, Bitcoin has broken below two previously held support levels at $74,800 and $70,400. The eight-hour RSI fell to 30.4 on June 2, its lowest since February 6, pointing to oversold conditions and sustained downward pressure.
Charts point to a liquidity cluster between $62,300 and $65,600, which overlaps with a demand zone stretching toward $60,000. Veteran trader Peter Brandt identified a broader concern, noting that Bitcoin appears to be forming an expanding triangle pattern on the daily chart.
Featured image from MetaAI, chart from TradingView


Read More

Bitcoin $300k–$500k Forecasts Run Into the Math That Defines a Maturing Market