
Bitcoin Cash (BCH) Pops 8% Higher — Can The Momentum Continue?

Share:
Predictions Markets
See what traders are focused on

Bitcoin Cash price started a major increase above the $475 resistance. BCH is consolidating and might aim for more gains above the $500 resistance.
- Bitcoin cash price started a fresh increase above the $480 level.
- The price is trading above $480 and the 100-hour simple moving average.
- There was a break above a key bearish trend line with resistance at $472 on the hourly chart of the BCH/USD pair (data feed from Kraken).
- The pair could start another increase if it clears the $500 resistance zone.
Bitcoin Cash Price Starts Fresh Surge
After forming a base above the $440 level, Bitcoin Cash price started a fresh increase. BCH outpaced Bitcoin and Ethereum to gain over 8%. There was a clear move above the $470 resistance zone.
The price even surpassed $480 and tested the $495 resistance zone. Besides, there was a break above a key bearish trend line with resistance at $472 on the hourly chart of the BCH/USD pair. A high was formed near $505 and the price is now consolidating gains above the 23.6% Fib retracement level of the upward move from the $455 swing low to the $502 high.
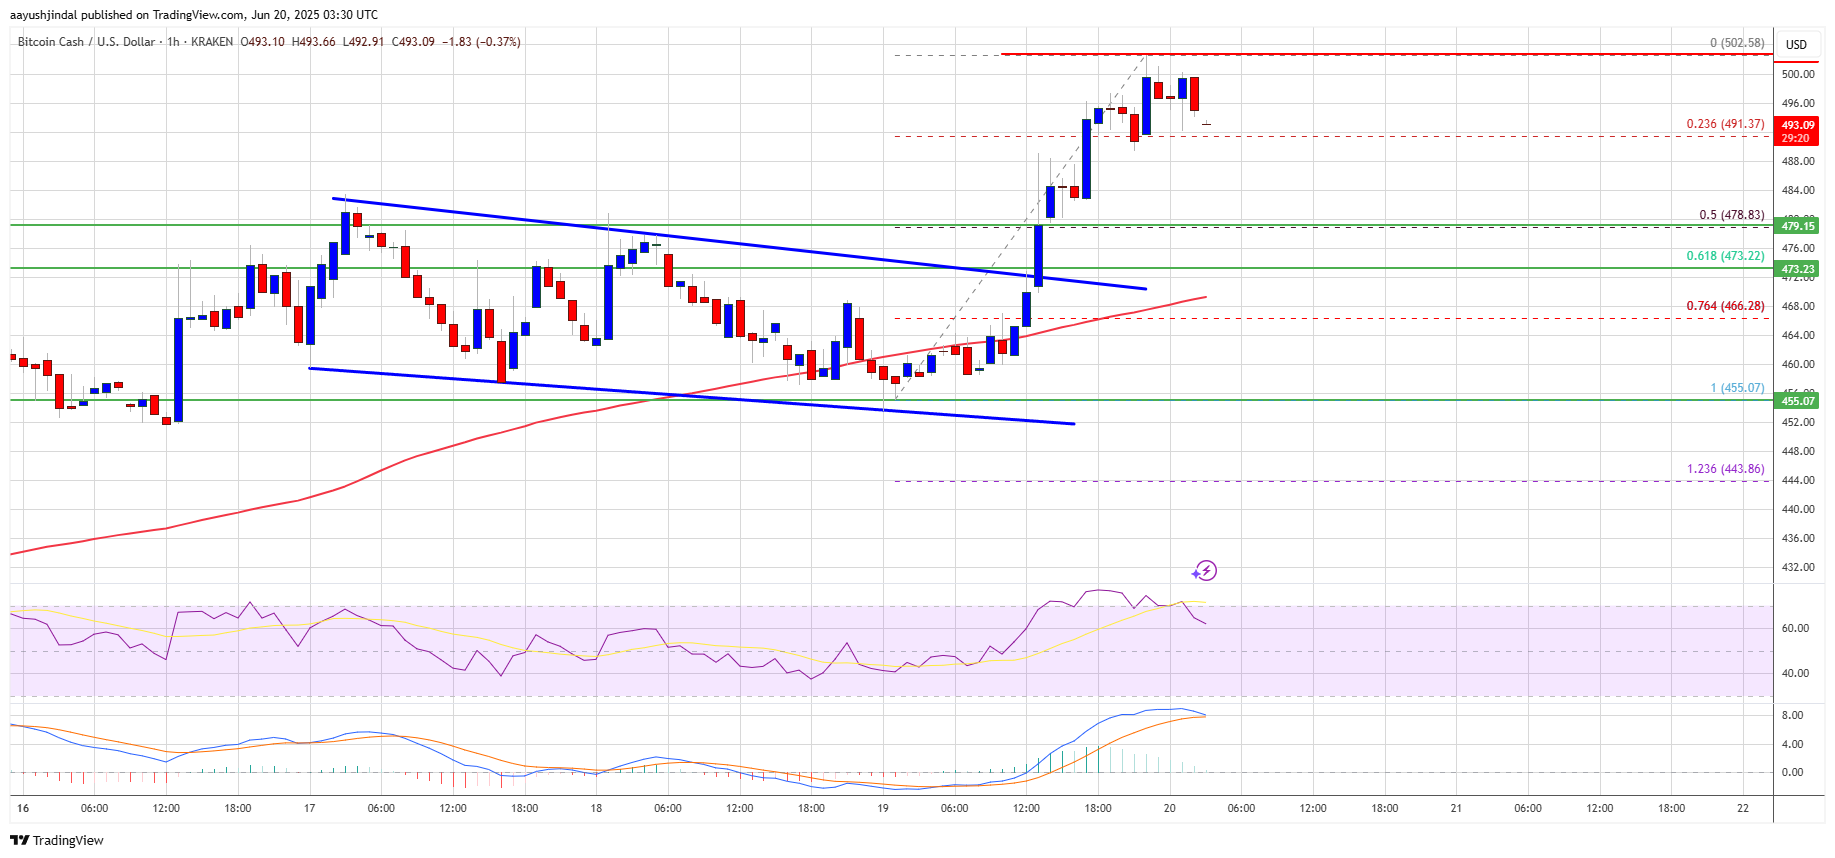
Bitcoin cash price is now trading above $485 and the 100-hour simple moving average. Immediate resistance on the upside sits near the $500 level. A clear move above the $500 resistance might start a decent increase. The next major resistance is $505, above which the price might accelerate higher toward the $520 level. Any further gains could lead the price toward the $535 resistance zone.
Are Dips Supported In BCH?
If Bitcoin Cash price fails to clear the $500 resistance, it could start a fresh decline. Initial support on the downside is near the $490 level. The next major support is near the $480 level or the 50% Fib retracement level of the upward move from the $455 swing low to the $502 high.
If the price fails to stay above the $480 support, the price could test the $470 support. Any further losses could lead the price toward the $450 zone in the near term.
Technical indicators
4-hour MACD – The MACD for BCH/USD is losing pace in the bullish zone.
4-hour RSI (Relative Strength Index) – The RSI is currently above the 60 level.
Key Support Levels – $490 and $480.
Key Resistance Levels – $500 and $505.
In This News
Coins

$ 64.05K
+1.09%
$ 0.0647
+0.38%
$ 1.87K
+0.75%
$ 213.15
+0.35%
$ 0.00...361


Predictions Markets
See what traders are focused on
Share:
In This News
Coins
$ 64.05K
+1.09%$ 0.0647
+0.38%$ 1.87K
+0.75%$ 213.15
+0.35%$ 0.00...361
Predictions Markets
See what traders are focused on
Share: