XRP Price Slips Back Into Danger Territory With Bears In Control
Share:
XRP fell below $1.28, printed a low at $1.2752 and is trading beneath the 100‑hour SMA with hourly MACD in the bearish zone and RSI under 50, indicating short-term weakness in the crypto token's price. If it remains below $1.30 and fails to clear resistance near $1.3150–$1.320 the downside targets are $1.2550 and $1.2320 (with $1.220–$1.20 as deeper support), while a close above $1.320–$1.340 would be required to shift momentum.
Predictions Markets
See what traders are focused on

XRP price extended losses and traded below $1.320. The price is now consolidating losses and faces hurdles near $1.2880 and $1.30.
- XRP price started another decline and traded below the $1.280 zone.
- The price is now trading below $1.280 and the 100-hourly Simple Moving Average.
- There is a bearish trend line forming with resistance at $1.3150 on the hourly chart of the XRP/USD pair (data source from Kraken).
- The pair could continue to move down if it stays below $1.30.
XRP Price Dips Below $1.280
XRP price failed to stay above $1.320 and extended its decline, like Bitcoin and Ethereum. The price declined below $1.3050 and $1.30 to enter a short-term bearish zone.
The price even extended losses below $1.2880. A low was formed at $1.2752, and the price is now consolidating losses well below the 23.6% Fib retracement level of the downward move from the $1.3642 swing high to the $1.2752 low.
The price is now trading below $1.2880 and the 100-hourly Simple Moving Average. If there is a fresh recovery move, the price might face resistance near the $1.2920 level. The first major resistance is near the $1.2960 level. The main resistance could be $1.3150 or the 50% Fib retracement level of the downward move from the $1.3638 swing high to the $1.2677 low at $1.320.
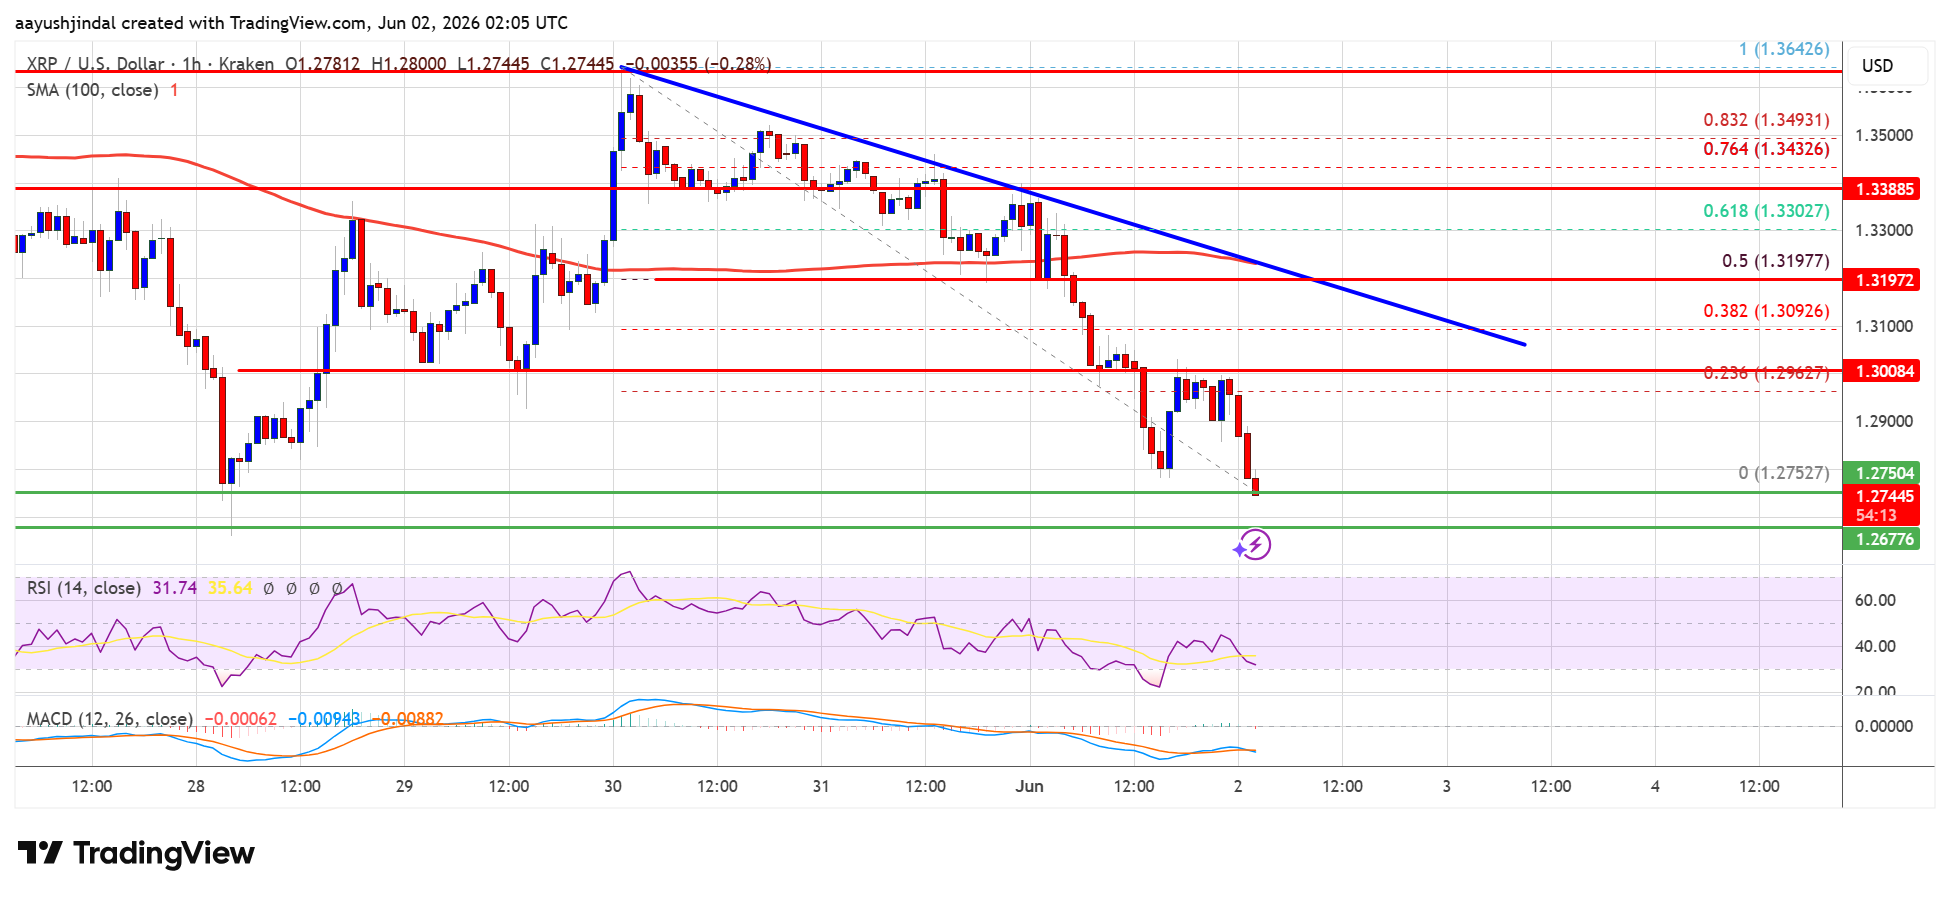
A close above $1.320 could send the price to $1.3275. The next hurdle sits at $1.340. There is also a bearish trend line forming with resistance at $1.340 on the hourly chart of the XRP/USD pair. A clear move above the $1.340 resistance might send the price toward the $1.3550 resistance. Any more gains might send the price toward the $1.3750 resistance.
More Losses?
If XRP fails to clear the $1.3150 resistance zone, it could start a fresh decline. Initial support on the downside is near the $1.2750 level. The next major support is near the $1.2550 level.
If there is a downside break and a close below the $1.2550 level, the price might continue to decline toward $1.2320. The next major support sits near the $1.220 zone, below which the price could continue lower toward $1.20.
Technical Indicators
Hourly MACD – The MACD for XRP/USD is now gaining pace in the bearish zone.
Hourly RSI (Relative Strength Index) – The RSI for XRP/USD is now below the 50 level.
Major Support Levels – $1.2750 and $1.2550.
Major Resistance Levels – $1.3000 and $1.3150.


Read More

Ripple Moves 1 Billion XRP In Latest Monthly Escrow Release
