XRP Price Surges Above Key Level, Bulls Take Full Control

Share:
XRP (crypto token) extended gains, trading above $1.420 and the 100‑hour SMA after a high of $1.4664 on Kraken (CEX); consolidating and may continue higher if it settles above $1.4650. Technical indicators bullish: hourly MACD rising and RSI >50; immediate resistances $1.4420 and $1.450, with upside targets $1.4840–$1.5150 on a clear break above $1.4650 (token performance, price outlook). Downside risk if $1.4650 holds: support at bullish trendline $1.4220 and $1.4080, with deeper supports $1.3880, $1.3650 and $1.3320 (risk, market impact).
Predictions Markets
See what traders are focused on

XRP price started a decent increase above $1.40. The price is now consolidating gains and might aim for more gains above the $1.4650 zone.
- XRP price started a steady increase above the $1.4120 zone.
- The price is now trading above $1.420 and the 100-hourly Simple Moving Average.
- There is a bullish trend line forming with support at $1.4220 on the hourly chart of the XRP/USD pair (data source from Kraken).
- The pair could continue to move up if it settles above $1.4650.
XRP Price Extends Gains above $1.420
XRP price started a fresh upward move above $1.380 and $1.3880, like Bitcoin and Ethereum. The price gained pace for a clear move above the $1.40 resistance.
The bulls even pumped the price toward the $1.4650 zone. A high was formed at $1.4664, and the price started a consolidation phase. There was a minor decline below the 23.6% Fib retracement level of the upward move from the $1.3510 swing low to the $1.46444 high.
The price is now trading above $1.420 and the 100-hourly Simple Moving Average. Besides, there is a bullish trend line forming with support at $1.4220 on the hourly chart of the XRP/USD pair.
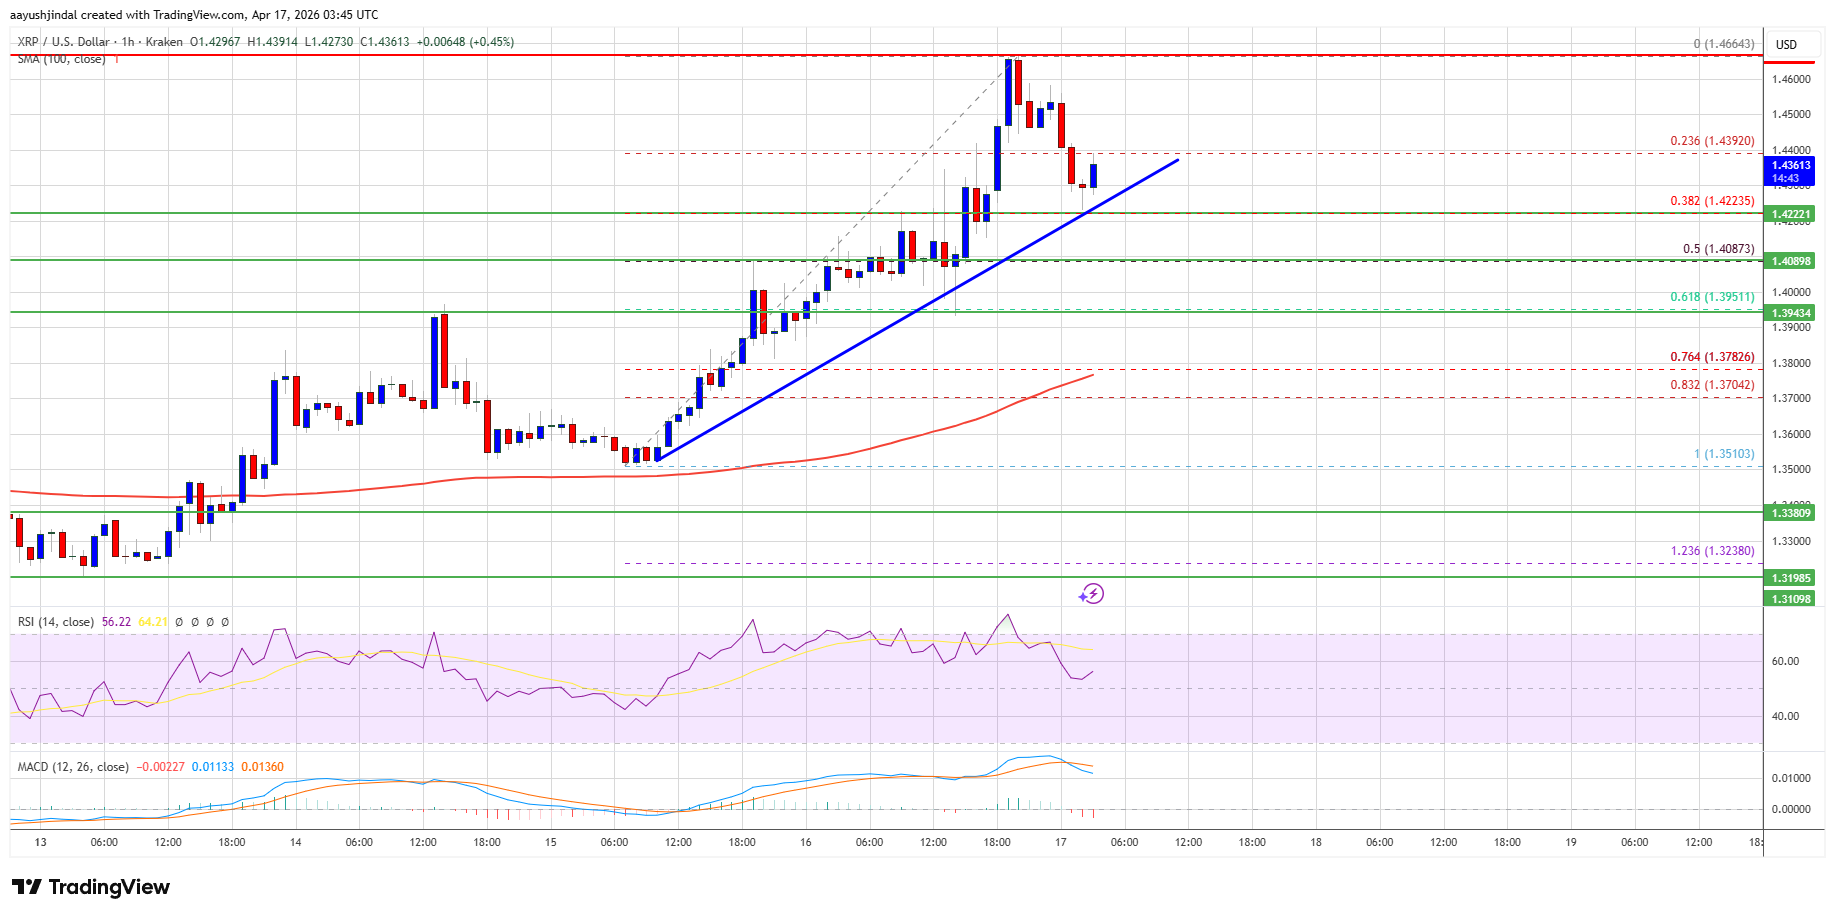
If there is a fresh upward move, the price might face resistance near the $1.4420 level. The first major resistance is near the $1.450 level, above which the price could rise and test $1.4650. A clear move above the $1.4650 resistance might send the price toward the $1.4840 resistance. Any more gains might send the price toward the $1.50 resistance. The next major hurdle for the bulls might be near $1.5150.
Downside Correction?
If XRP fails to clear the $1.4650 resistance zone, it could start a fresh decline. Initial support on the downside is near the $1.4220 level. The next major support is near the $1.4080 level or the 50% Fib retracement level of the upward move from the $1.3510 swing low to the $1.46444 high.
If there is a downside break and a close below the $1.4080 level, the price might continue to decline toward $1.3880. The next major support sits near the $1.3650 zone, below which the price could continue lower toward $1.350. The main support could be $1.3320.
Technical Indicators
Hourly MACD – The MACD for XRP/USD is now gaining pace in the bullish zone.
Hourly RSI (Relative Strength Index) – The RSI for XRP/USD is now above the 50 level.
Major Support Levels – $1.4080 and $1.3880.
Major Resistance Levels – $1.4500 and $1.4650.


Read More
Could XRP Hit $10 This Bull Run? World’s Highest IQ Holder Thinks So
