Shiba Inu ‘Underbought,’ While Bitcoin ‘Overbought’ Recently: Santiment

Share:
Predictions Markets
See what traders are focused on

According to this metric, the on-chain analytics firm Santiment has revealed Shiba Inu has been underbought recently, while Bitcoin is overbought.
MVRV Z-Score Suggests Shiba Inu Has Been Undervalued Recently
In a new post on X, Santiment has discussed how some of the top cryptocurrencies are looking like right now on their MVRV Z-Score. The “Market Value to Realized Value” (MVRV) refers to a popular on-chain indicator that keeps track of the ratio between the market cap and realized cap for any given asset.
The realized cap here is a capitalization model that calculates the total valuation of the cryptocurrency by assuming that the ‘real’ value of any token in circulation is equal to the price at which said coin was last transacted on the blockchain.
As the previous transaction of any coin was the last time it changed hands, the price at its time would denote its cost basis. Thus, the realized cap is a sum of the cost basis of all tokens in the circulating supply.
Put another way, this model measures the total capital the investors used to purchase the asset’s supply. The market cap, in contrast, keeps track of the value these investors hold. As such, the MVRV, which compares these two metrics, tells us about the profit/loss situation of the investors as a whole.
In the context of the current topic, the actual metric of interest is the “MVRV Z-score.” This indicator takes the difference between the market cap and the realized cap and divides it by the standard deviation of the market cap over the asset’s entire history.
Now, here is the chart shared by Santiment that shows the trend in this indicator for various coins in the sector:
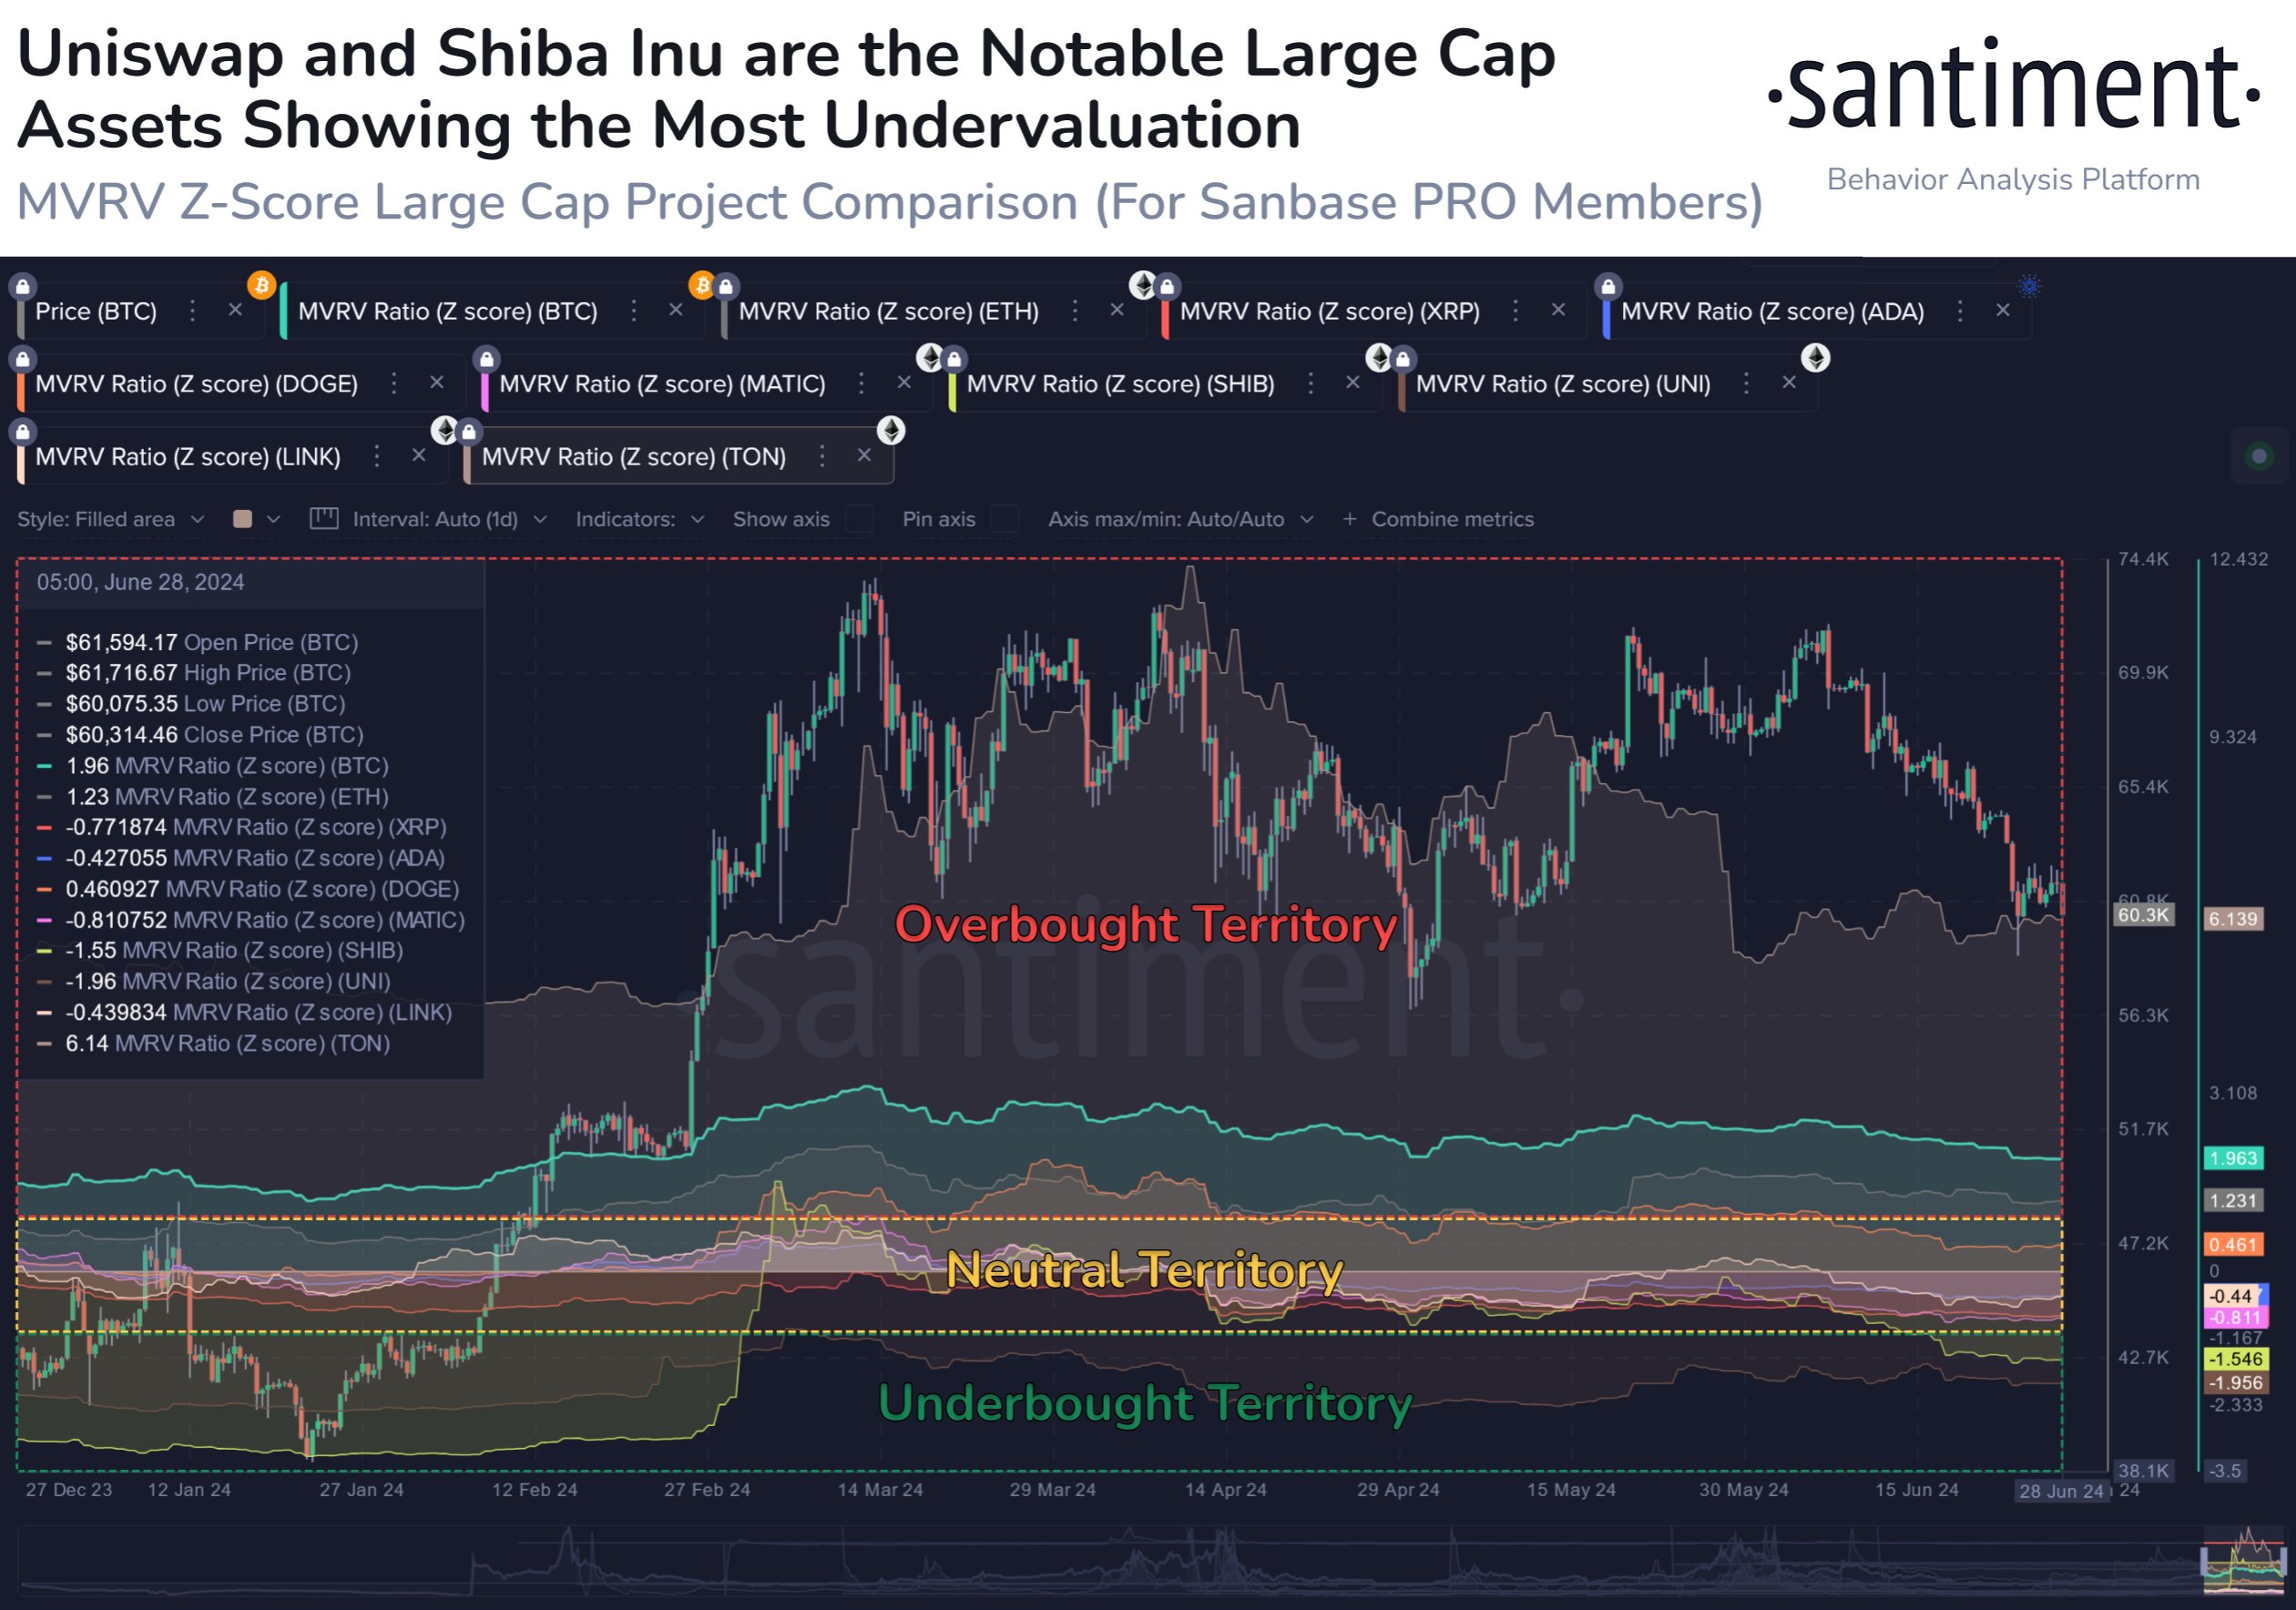
Based on the MVRV Z-Score, Santiment has defined three zones that relate to how far from its fair value the asset is. The chart shows that Shiba Inu (SHIB) and Uniswap (UNI) have had the indicator at -1.55 and -1.96 recently, putting these assets inside the ‘underbought’ territory.
At these MVRV Z-Score values, the market cap is significantly lesser than the realized cap, meaning investors are widely lost. Generally, profit holders are a more likely source of selling pressure in the market, so when there are few of them left, price corrections can become less probable.
This is why assets are considered undervalued when the indicator drops below the -1 level for them. Due to a similar reasoning, values above 1 correlate to the coin being overvalued.
Bitcoin (BTC), Ethereum (ETH), and Toncoin (TON) have recently been inside this latter territory, suggesting that their prices could be in danger of seeing bearish action. Shiba Inu and Uniswap, on the other hand, could be better set up for a price surge.
SHIB Price
At the time of writing, Shiba Inu is trading around $0.0000171, up 2% over the past week.
In This News
Coins

$ 63.41K
+0.65%
$ 1.88K
+0.38%
$ 0.186
+9.75%
$ 0.00595
-1.21%
$ 0.0703
+0.50%


Predictions Markets
See what traders are focused on
Share:
In This News
Coins
$ 63.41K
+0.65%$ 1.88K
+0.38%$ 0.186
+9.75%$ 0.00595
-1.21%$ 0.0703
+0.50%Predictions Markets
See what traders are focused on
Share: