XRP Eyes $8.30 Target As Rare Chart Pattern Emerges From Prolonged Decline

Share:
XRP (~$1.30) is in a nine‑month falling wedge after six consecutive monthly losses; analyst projects a potential drop to ~ $0.83 before any sustained rebound. Key crypto price levels: a close above $1.80 would invalidate the wedge; the 83–91¢ support zone is critical; a successful breakout scenario targets $8.30. Risk/market impact: conditional technical setup — large upside possible if support holds, but a break below 83–91¢ points to deeper weakness in the token’s price.
Predictions Markets
See what traders are focused on

A drop to 83 cents could be the setup XRP investors have been waiting for.
Crypto analyst Egrag Crypto has identified a falling wedge structure in XRP’s price chart that spans nearly nine months, with the token trading around $1.30 after a prolonged slide.
Based on the analysis, XRP may fall further before any significant recovery — but that bottom could mark the start of a sharp move higher, potentially reaching $8.30.
Six Painful Months
XRP has now posted six straight months of losses, its worst such run since 2014. April is already trending negative, down 1.80% in the first days of the month. If it closes in the red, it would be the seventh consecutive monthly loss — a first in the token’s history.
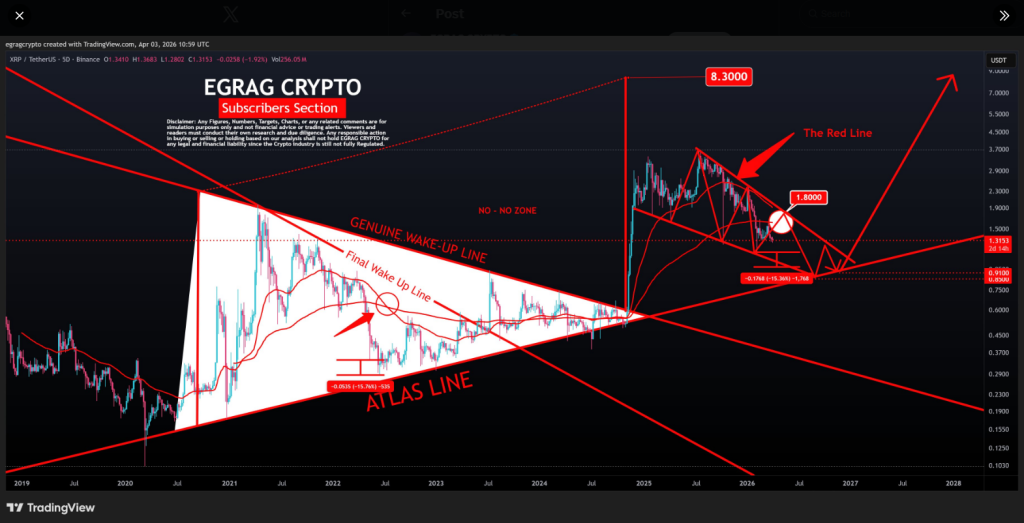
The token peaked at $3.60 in July 2025. Since then, the price has been compressed between two downward-sloping lines — a resistance ceiling above and a support floor below. Each time the price has hit either line, it has reversed course. That back-and-forth movement is what defines the wedge pattern.
#XRP – The RED Chart
:
It’s red… but it’s offering one of the best buying opportunities and upside potential for #XRP.
Closing above $1.80 = invalidation of the falling wedge
Otherwise:
Bottom target: crystal clear →… pic.twitter.com/TcXESiXvzK
— EGRAG CRYPTO (@egragcrypto) April 3, 2026
Two Key Price Levels Are Driving The Outlook
Egrag’s chart shows XRP may first push up to $1.80, where the upper resistance line sits. Reports indicate that level has rejected previous recovery attempts, most recently in early January 2026 when the price hit $2.41 and pulled back sharply. A similar rejection at $1.80 would send the price downward again.
From there, the projected path leads to approximately 83 cents — the point where the wedge’s lower support line meets a long-term upward trendline the analyst calls the Atlas Line.
That level is described as the major floor for the current structure. Data from the chart shows XRP could then bounce back above $1.00, dip once more to around 91 cents to retest support, and then begin a larger move upward.
If that sequence plays out, the breakout target lands at $8.30.
The wedge has already absorbed several significant price swings. During a market selloff on October 10, 2025, XRP fell from $2.80 down to $1.36, touching the lower trendline. The price bounced from that level. In early February 2026, another drop brought the token to $1.11 before support held again.
Breakout Conditions Depend On Two Clear BoundariesThe bullish case has limits. According to Egrag’s analysis, a close above $1.80 on the upper resistance line would break the wedge pattern and cancel the current setup entirely.
On the downside, a drop below the 83-to-91-cent support zone would point to deeper weakness and raise the possibility of further decline beyond what the chart currently projects.
Featured image from Pexels, chart from TradingView


Read More
XRP News: OSL HK Opens Retail Trading as XRP Price Rises, OI Falls