Bitcoin, Ethereum & XRP Surge Over 25% in August—Will the Rally Hold Until the End of Q3, 2026?
Share:
Bitcoin, Ethereum and XRP staged a strong Q3 2026 rebound after weak Q1/Q2, with August rallies lifting BTC ~25%, ETH ~56% and XRP ~45% through August; BTC trades around $78,000 with $80,000–$82,000 resistance, ETH is at $2,452 facing a $2,500–$2,550 MA barrier, and XRP pulled back to ~$1.37 with $1.30–$1.35 support. The price momentum improves crypto token performance and market sentiment across DeFi, DEX and CEX venues, but cooling volumes, mixed indicators (RSI, CVD, MACD) and imminent resistance/support tests in September mean the rally’s extension and broader adoption remain contingent on breakout or profit-taking risks.
Predictions Markets
See what traders are focused on

Bitcoin, Ethereum & XRP have entered the final weeks of Q3 2026 with a strong August rally backing them. While Bitcoin attracted nearly 25% gains, Ethereum & XRP surged more than 30% each. The broader crypto market recovery is believed to have brought the three major cryptos back into focus as traders assess whether the latest momentum can extend until the end of Q3 2026.
Q1 & Q2 Weakness Pave Way for a Strong Q3 Rebound
Bitcoin, Ethereum and XRP started 2026 with a strong bearish influence that compelled the price to form lower highs and lows. All three top cryptos faced massive selling pressure throughout the first half of the year, bringing the levels towards the yearly lows. Q1 extended the initial weakness, while Q2 kept the broader crypto market under pressure. Further, Q3 has brought a sharp reversal in momentum.
| Crypto | Q1 Gains | Q2 Gains | Q3* Gains |
| Bitcoin | -22.1% | -14.1% | +33.2% |
| Ethereum | -29.1% | -25.3% | +56.2% |
| XRP | -27.1% | -22.4% | ~+45% |
*Q3 performance through August 2026
The picture has dramatically changed in Q3, where BTC, ETH & XRP prices have posted strong double-digit gains, overcoming double-digit losses earlier. This sharp shift in quarterly performance highlights just how quickly market sentiment has changed. But with the rally advancing in September, towards the end of Q3, the bigger question is whether this momentum can survive until the end of the month.
Bitcoin Price Analysis for September 2026- Can it Break $80,000?
Bitcoin has maintained its strong Q3 recovery, but the rally is now approaching a key resistance zone. After rebounding, the price is chopping around $78,000, but the weekly chart suggests the top crypto is yet to test a major hurdle. However, the price has risen above a crucial resistance zone between $70,000 and $72,000 that keeps the bullish momentum intact.
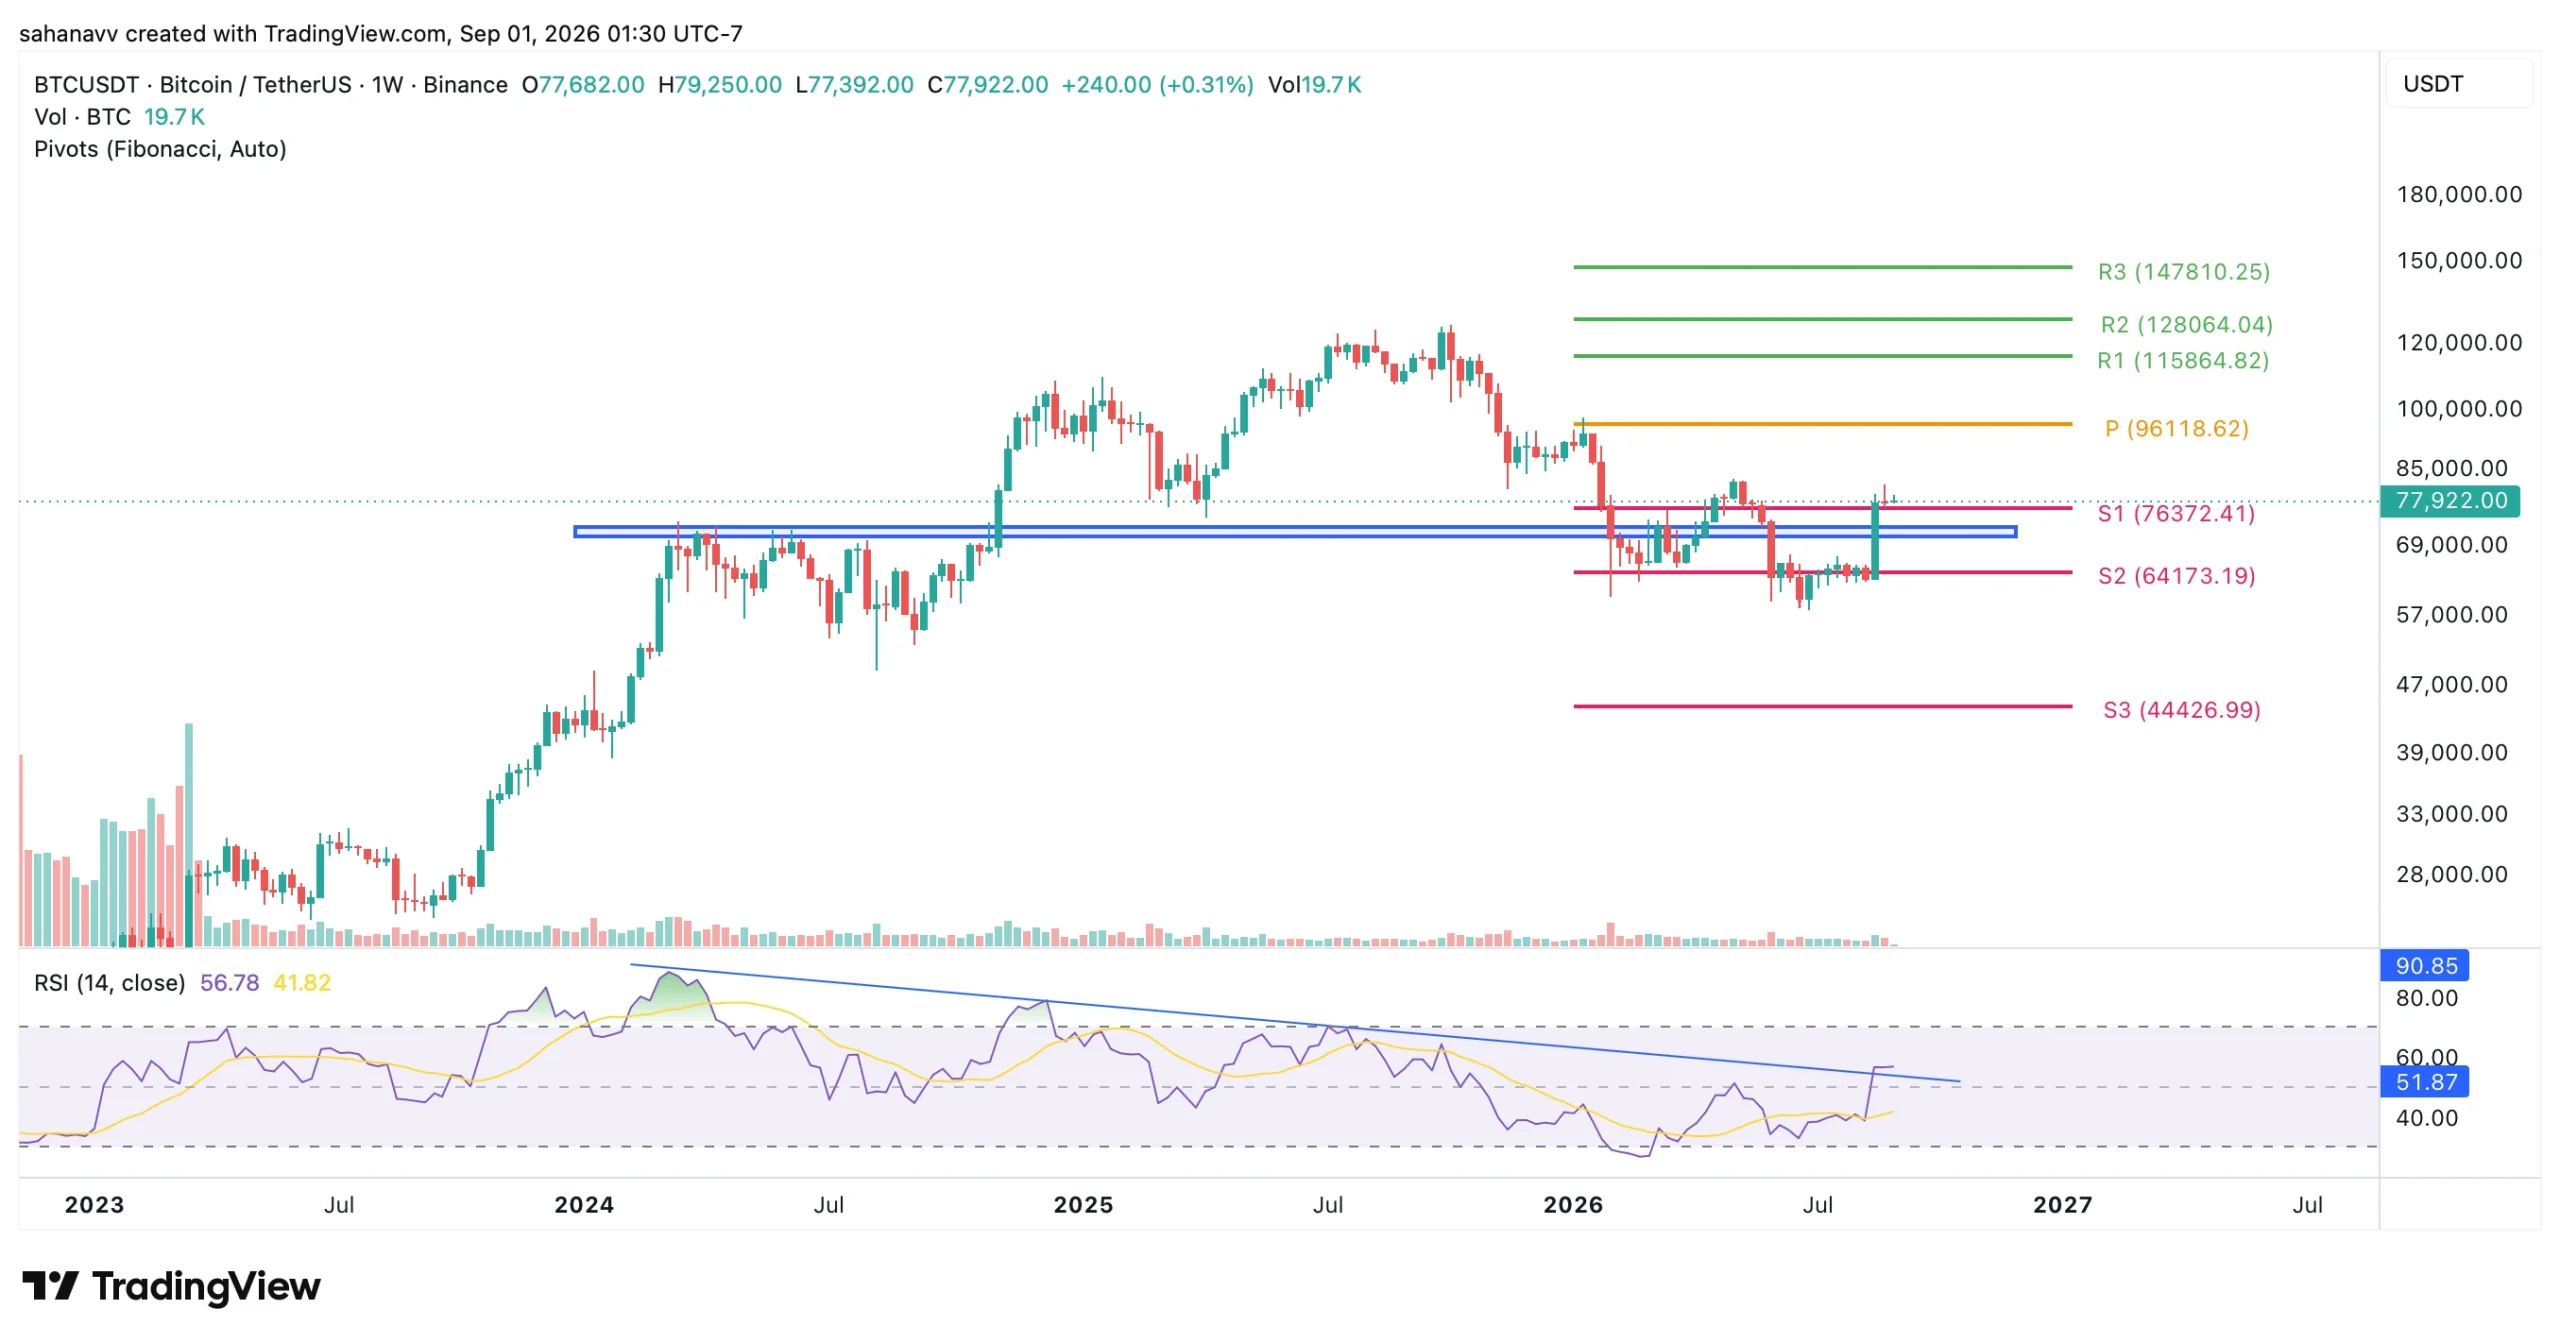
Besides, the weekly RSI is sitting in the mid 50’s, keeping Bitcoin in a relatively neutral momentum zone. Importantly, the RSI has broken above the multi-year trendline, which suggests the long-term momentum is turning bullish. For now, $80,000 to $82,000 is the immediate area bulls need to overcome that may pave the way for the rally to test higher targets.
Ethereum Price Analysis for September 2026- How High Can ETH Go?
The Ethereum price has recovered to $2,452, and with this, the second-largest token has approached a major hurdle. The price seems to have found a strong base at the 200-day MA, which may trigger a strong upswing. Interestingly, the moving-average cluster of 50 & 200 days is expected to play a major role in the next few days.
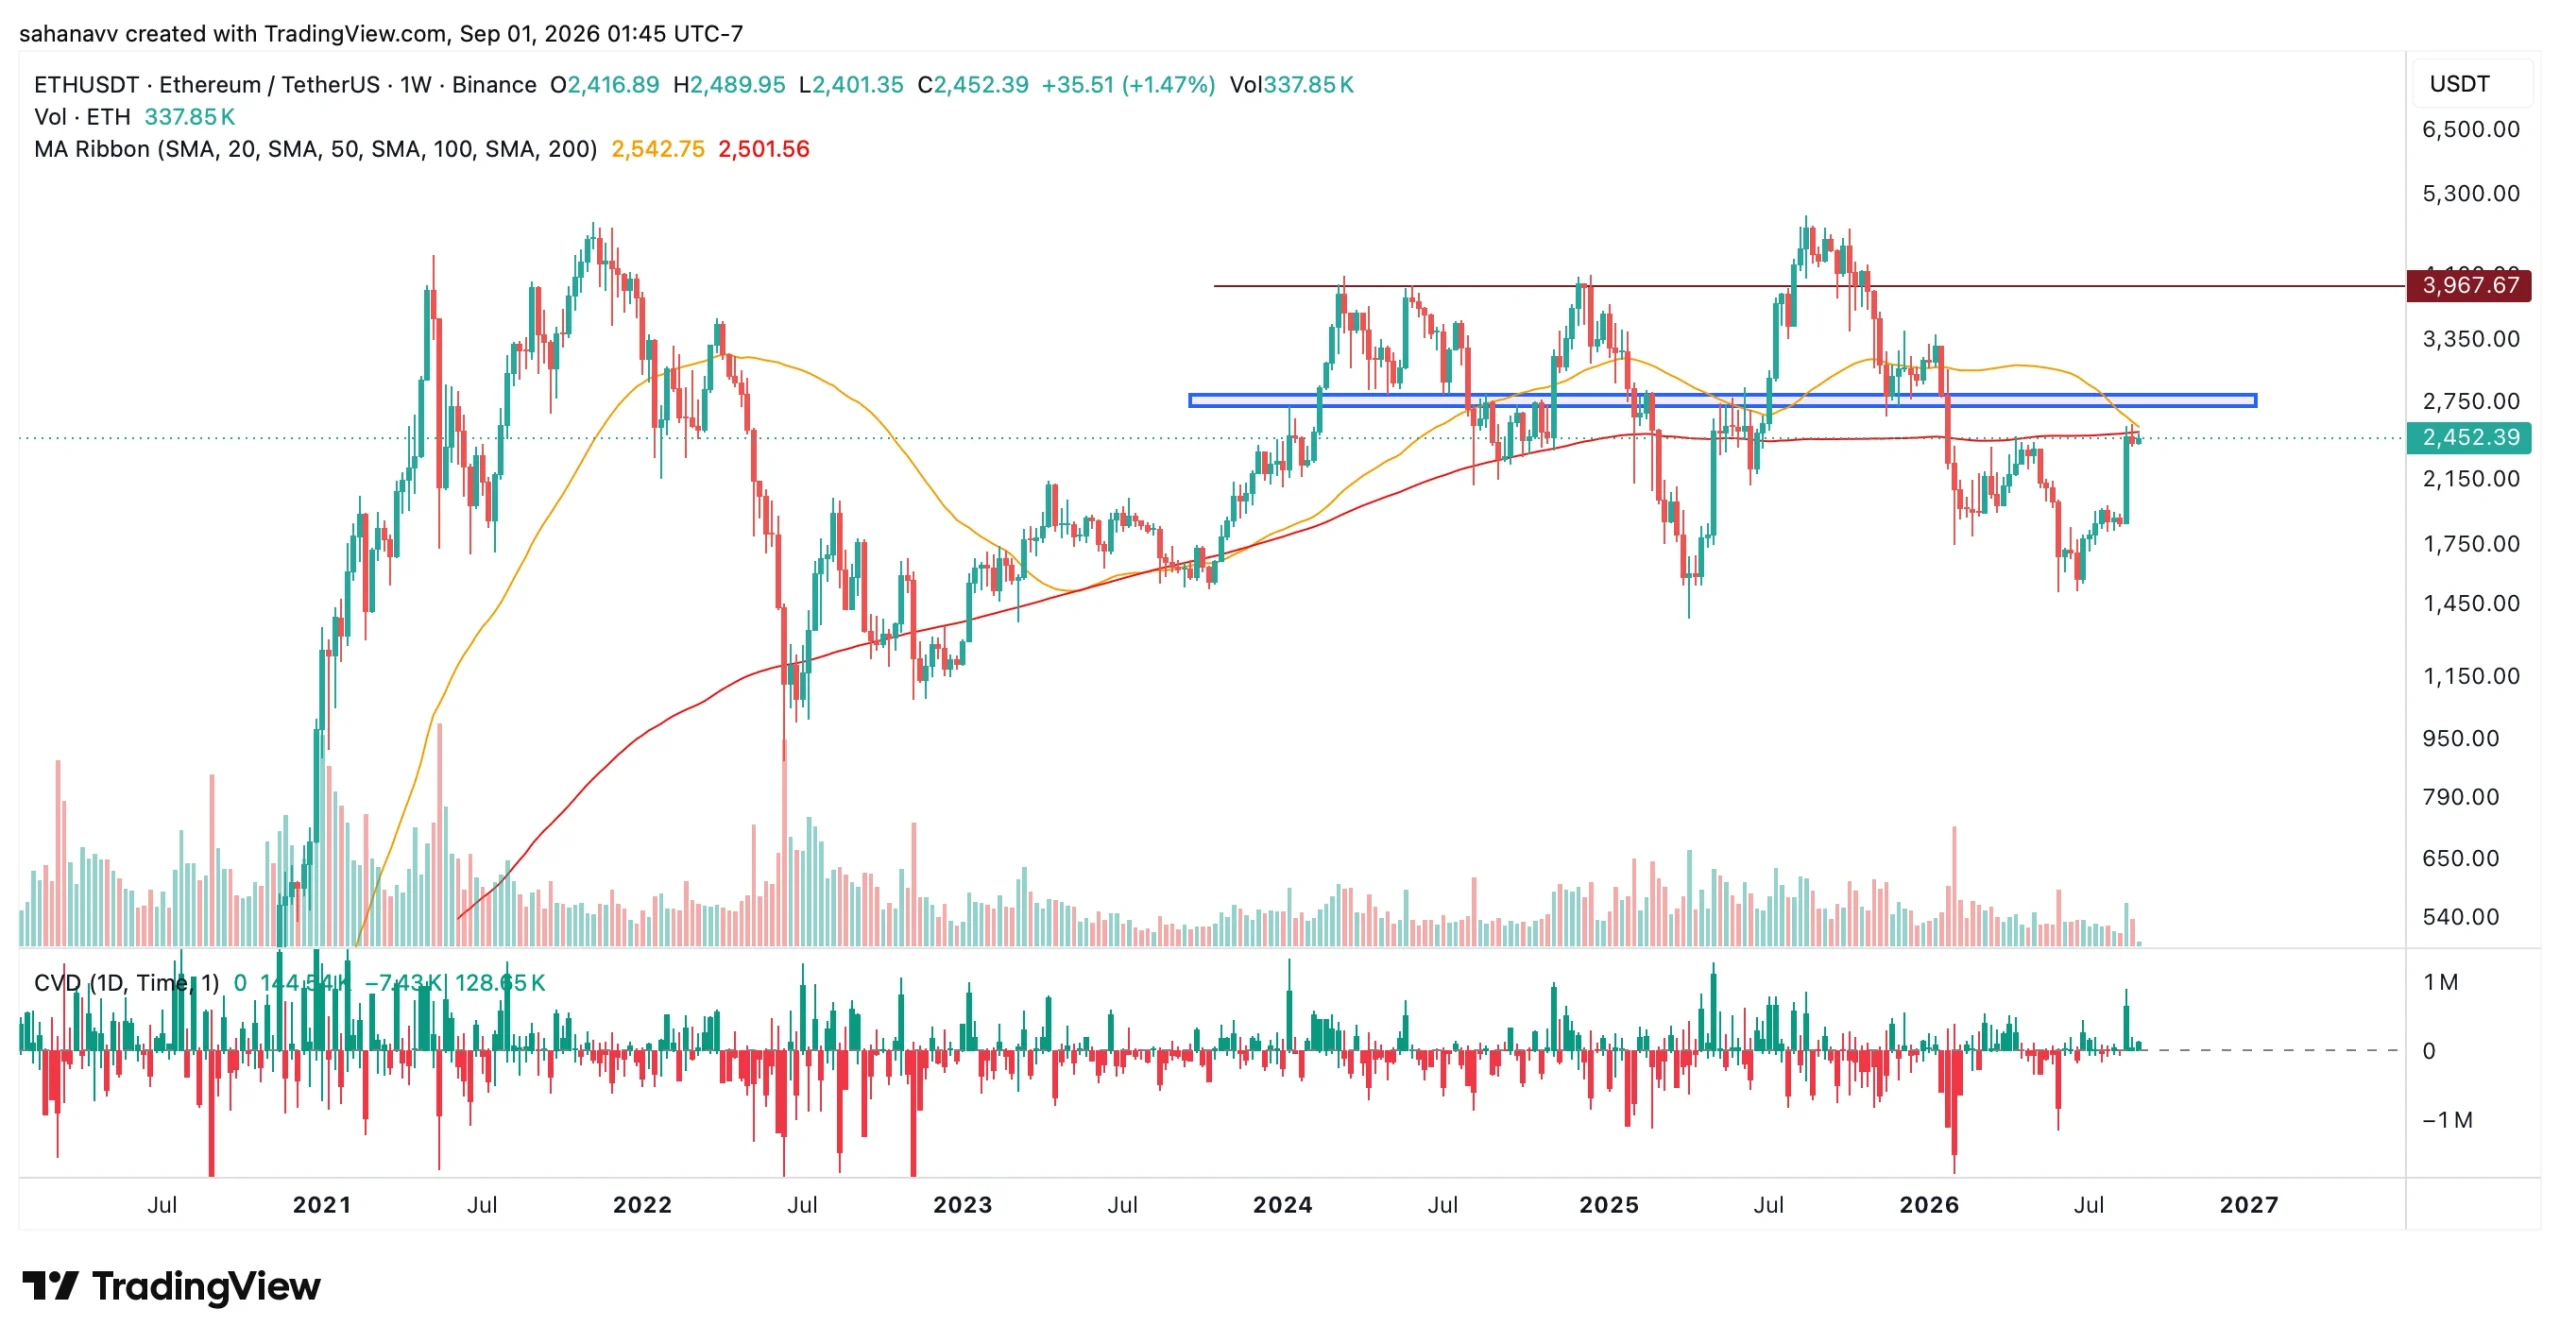
As seen in the above chart, the weekly 50/200-day MAs have been approaching for a bearish crossover. However, the MAs have tried undergoing a death cross earlier, but the bulls staged a strong recovery, and a similar rebound is expected in the next few days. Besides, the recent CVD has started to turn positive, suggesting that buying pressure is returning alongside the price recovery. However, the improvement is still modest, and trading volume has cooled from the spikes seen during previous major moves.
XRP Price Analysis for September 2026- Can XRP Hold Above $1.35 After the Rally?
XRP’s sharp rebound in the past few days has brought the token back into a familiar trading range. After rebounding from the local lows near $1, the price surged to $1.66 and further corrected to $1.37. Currently, the price is trading just above the $1.30 to $1.35 support range, making it the first level to watch if the correction continues.
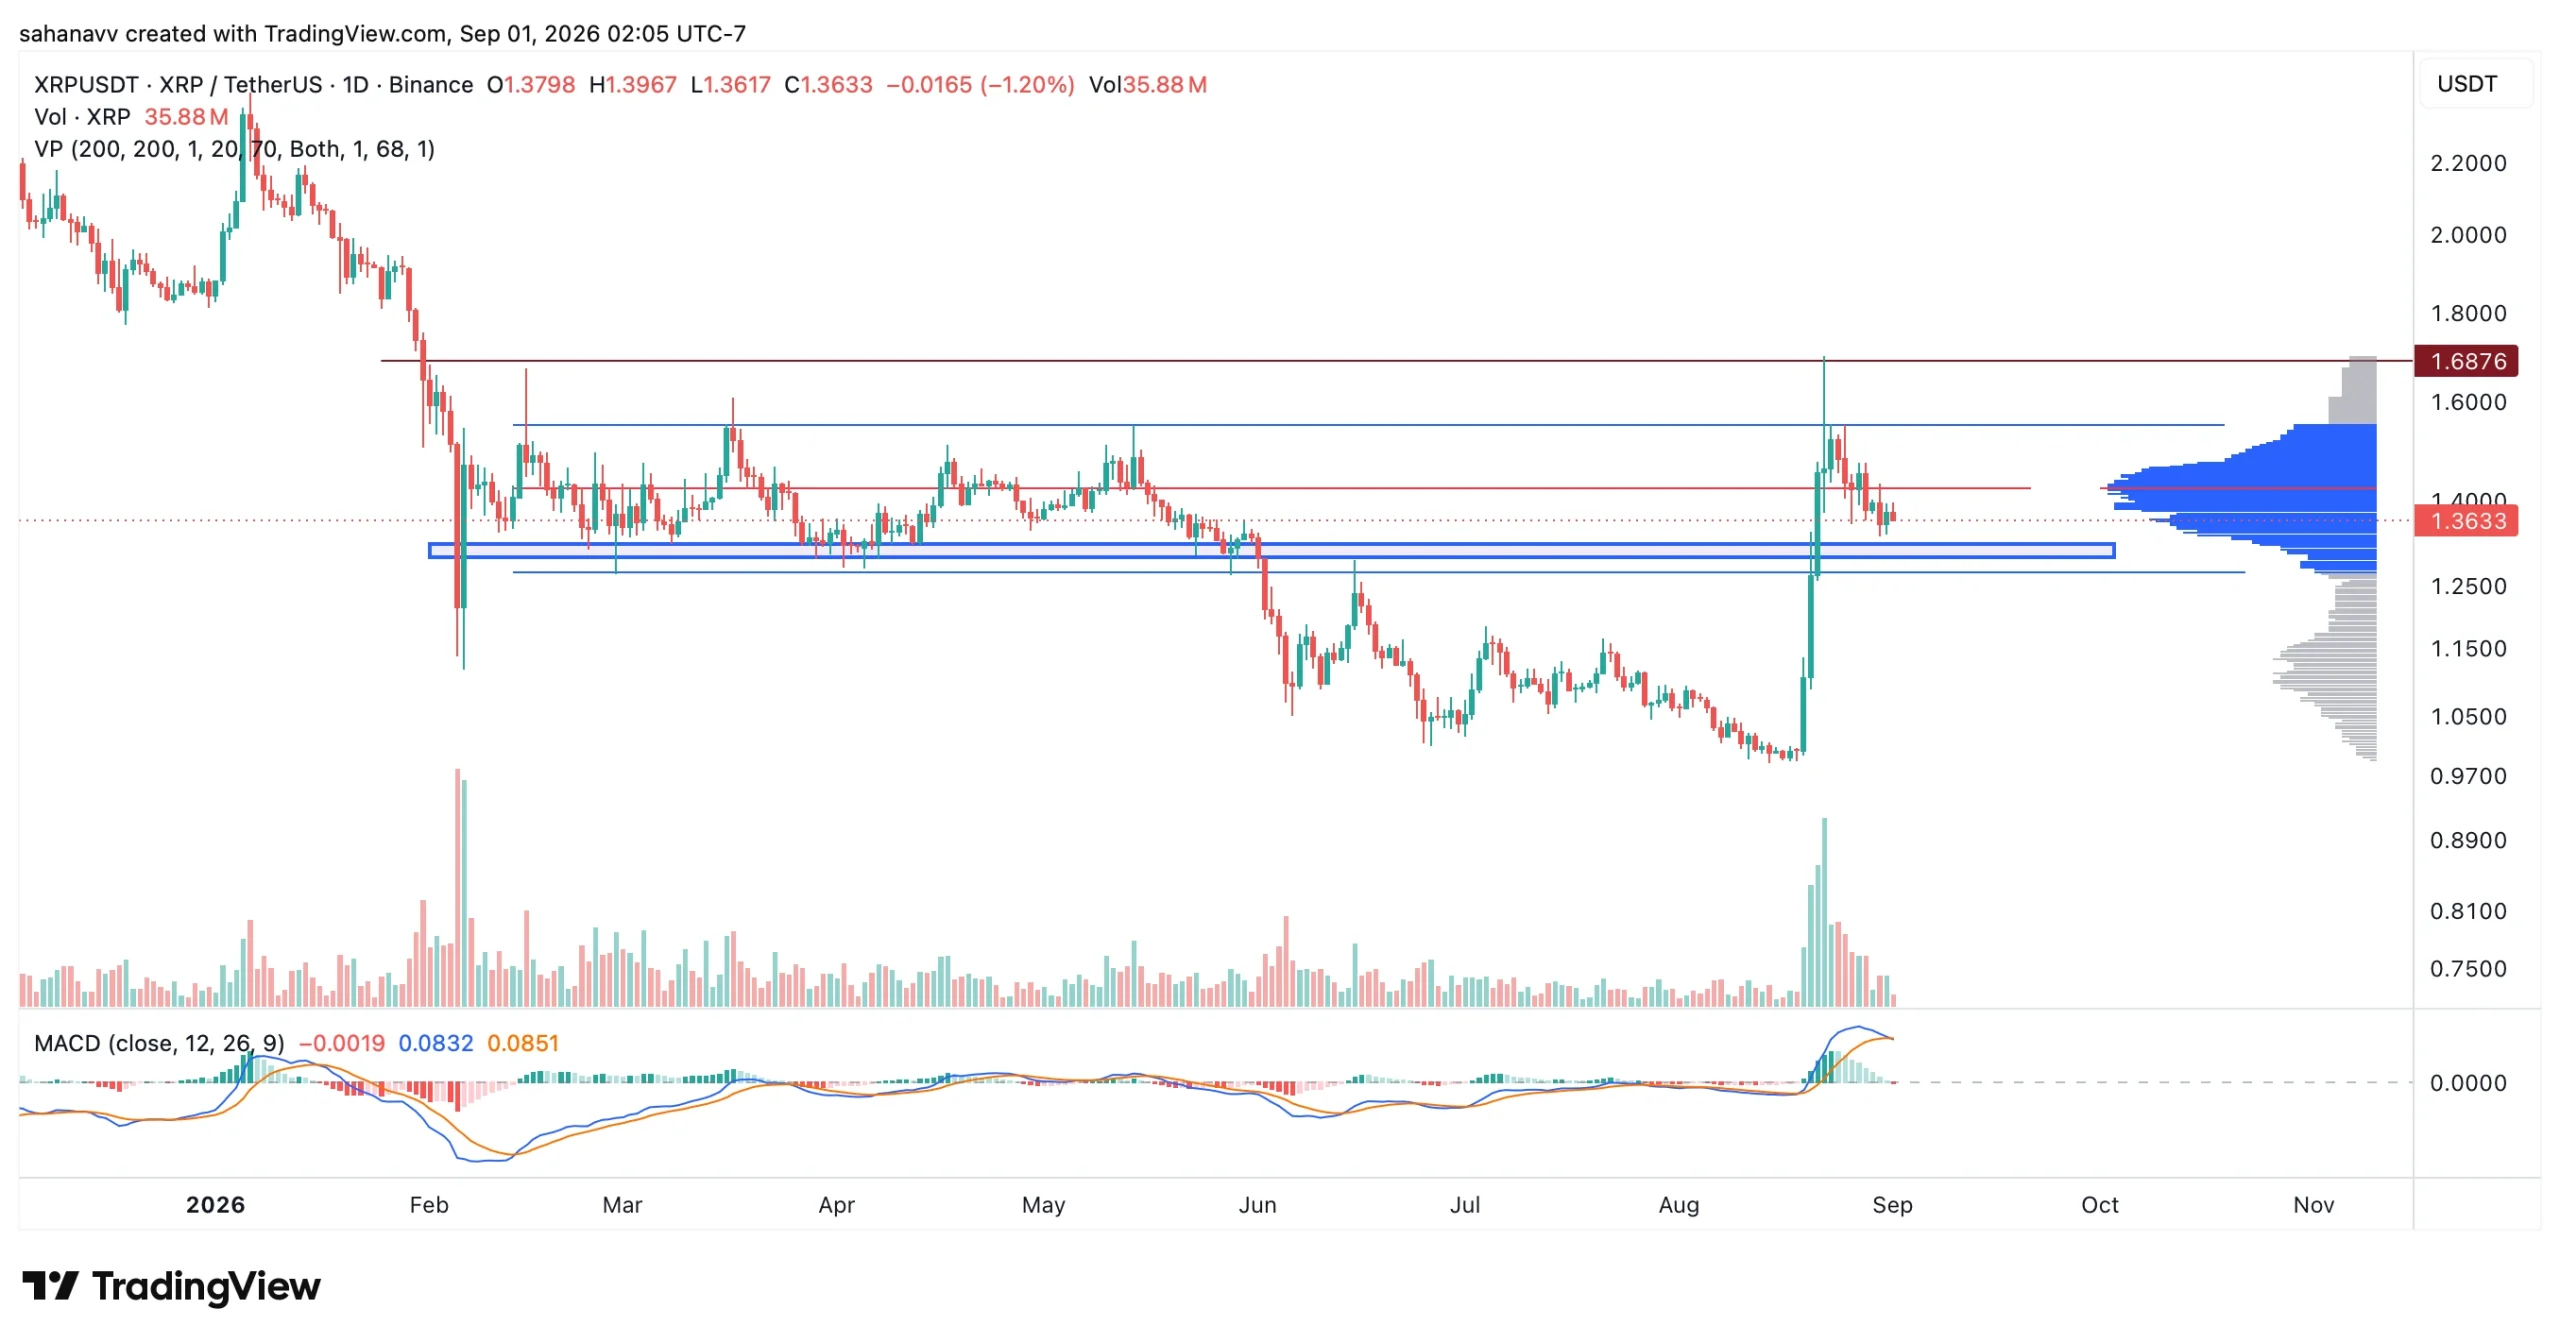
The most interesting indicator is the MACD that suggests the broader momentum is bullish, but it also shows a drop in buying pressure. Moreover, the levels are heading for a bearish crossover, suggesting the initial buying momentum is losing some strength. On the other hand, the volume profile shows substantial trading activity around the current price range. This suggests the token has built a significant area of participation between $135 and $1.45, making it an important zone for the next move.
The Bottom Line—Can Bitcoin, Ethereum & XRP Rally Hold Until End of Q3?
Bitcoin, Ethereum and XRP have made a strong comeback in Q3 after a difficult first half of 2026; however, now they have entered a decisive phase. The BTC price needs to overcome the $80,000 to $82,000 resistance zone, while the ETH price is approaching the $2,500 to $2,550 MA barrier range. XRP, meanwhile, must defend the $1.30 to $1.35 support range after its sharp advance.
A successful breakout across the key resistance would strengthen the case for further upside, while a loss of major support could signal that traders are taking profit after the powerful Q3 rally.


Read More
ARB Price Surges 30%: Arbitrum Breaks Out as $814M Volume Ignites Fresh Rally