Ethereum Price Could Rally To $10,000 If This Major Resistance Is Broke

Share:
Predictions Markets
See what traders are focused on

Ethereum’s price action this week has been very notable, with the leading altcoin breaking above $2,800 again for the first time in four months. Ethereum managed to break above the $2,800 mark for the first time since February, briefly touching $2,870 before pulling back slightly.
Two separate analyses by crypto strategist Crypto Patel on the social media platform X suggests Ethereum is now on the right track. The first, based on an 8-hour chart, highlights a rally toward $4,000. The second, using a long-term two-week timeframe, outlines a bullish setup that could send Ethereum soaring to $10,000 and beyond.
Ethereum’s Breakout From Sideways Consolidation Zone
In a recent analysis shared on X, a crypto analyst known as Crypto Patel highlighted Ethereum’s attempt to break out of its established range. Using the 8-hour candlestick chart, he pointed out how the Ethereum had spent many weeks since early May trading between clear support at $2,366 and resistance around $2,734. The breakout seen on the chart occurred just above this resistance zone, when Ethereum briefly pushed past $2,800 before facing some rejection.
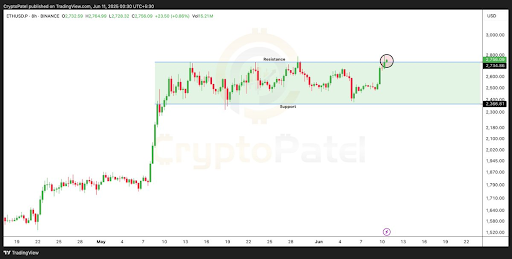
If this breakout holds above $2,800, Ethereum could initiate a steep upward rally toward the $3,500 to $4,000 region in the coming weeks. Crypto Patel noted the importance of watching whether Ethereum sustains above the $2,750 breakout line, as a successful confirmation could trigger an influx of bullish momentum.
Ethereum’s To $10,000 In The Long-Term
In a follow-up post analyzing a much larger timeframe, Crypto Patel shared a two-week candlestick chart that mapped Ethereum’s longer-term structure since 2018. The chart revealed a well-defined bullish setup, including a bounce from a key bullish order block around $1,400 in April. This bounce acted as a support level, with the resulting candlestick being a bullish one that broke through another order block between $1,700 and $2,500.
Patel pointed out that Ethereum is now showing signs of a long-term bullish continuation pattern. With support levels already locked in for the next bear market, the analyst projected a target above $10,000, citing a 438% upside potential from current price levels. The chart also marks $2,500 as a structural pivot point, with Ethereum’s ongoing upward trajectory expected to strengthen if this support level continues to hold.
Therefore, the path to $10,000 will depend on Ethereum’s ability to turn its recent resistance break into sustained momentum. The $2,800 region must now serve as a support base rather than a resistance ceiling. However, this has failed to really materialize in the past 24 hours, as Ethereum is currently down by a massive 9.6%.
The ensuing price action has seen the leading altcoin now back trading within this consolidation range. Failure to hold above $2,500 could cascade to more losses over the weekend until it closes on $2,366 again and probably initiate another bounce from here.
In This News
Coins

$ 63.89K
+1.93%
$ 0.0774
+0.63%
$ 1.79K
+3.07%
$ 0.00712
-1.18%
$ 0.00...361


Predictions Markets
See what traders are focused on
Share:
In This News
Coins
$ 63.89K
+1.93%$ 0.0774
+0.63%$ 1.79K
+3.07%$ 0.00712
-1.18%$ 0.00...361
Predictions Markets
See what traders are focused on
Share:
Read More

Cryptocurrency Market Activity: Bitcoin Surpasses $64,000, Whale Activity is High! Here are the Altcoins They’re Trading