Can Solana hold $80 as ETF inflows fail to stop the latest selloff?

Share:
Crypto markets opened the week bearish with Bitcoin at $76,965 (‑1.5%) and Ethereum around $2,100 while Solana slid 2.3% to under $85, down 10% on the week despite Solana spot ETFs recording four days of inflows totaling $58.12 million. Retail deleveraging and bearish derivatives metrics — over $600 million in liquidations, SOL futures open interest falling from $6.77B to $5.45B and a long‑to‑short ratio of 0.9727 — plus price trading below the 50/100/200‑day EMAs ($87.90/$93.26/$108.51), RSI near 40 and a bearish MACD signal suggest the path of least resistance is lower with support at $77.60–$75.63 and a daily close above $87.90 needed to restore bullish momentum.
Predictions Markets
See what traders are focused on


The cryptocurrency market opened the new weekly candle bearish, with the leading cryptocurrencies picking up from where they left off last week.
Bitcoin, the leading cryptocurrency by market cap, is down by 1.5% in the last 24 hours and is now trading at $76,965.
Ethereum is also trading around $2,100 at press time on Monday.
SOL, the native coin of the Solana blockchain, is also in the red as it has lost 2.3% of its value over the last 24 hours.
Solana is now trading below $85, extending losses for a fourth consecutive session as weakening retail participation overshadowed continued institutional inflows into Solana-focused exchange-traded funds (ETFs).
SOL ETFs attract fresh inflows
Solana is down 10% in the last seven days despite US-listed Solana spot ETFs recording four straight days of inflows last week, totaling $58.12 million, according to data from CoinGlass.
The steady inflows reflect renewed institutional interest in Solana, with demand climbing to levels last seen in mid-December.
However, the broader cryptocurrency market downturn continues to weigh heavily on sentiment.
More than $600 million in crypto liquidations across the market have triggered a pullback in retail participation, particularly in Solana derivatives trading.
However, retail interest in Solana has declined over the past few days.
Data fromCoinGlass shows Solana futures Open Interest (OI) fell sharply to $5.45 billion from $6.77 billion recorded last Tuesday, signaling a steep decline in outstanding leveraged positions.
The drop in OI suggests retail traders are exiting the market amid rising uncertainty and risk-off sentiment.
Bearish positioning also remains dominant in derivatives markets.
Solana’s long-to-short ratio currently sits at 0.9727, remaining below the neutral 1.0 threshold and indicating that short positions continue to outnumber bullish bets.
Technical outlook: SOL could decline below $80 support
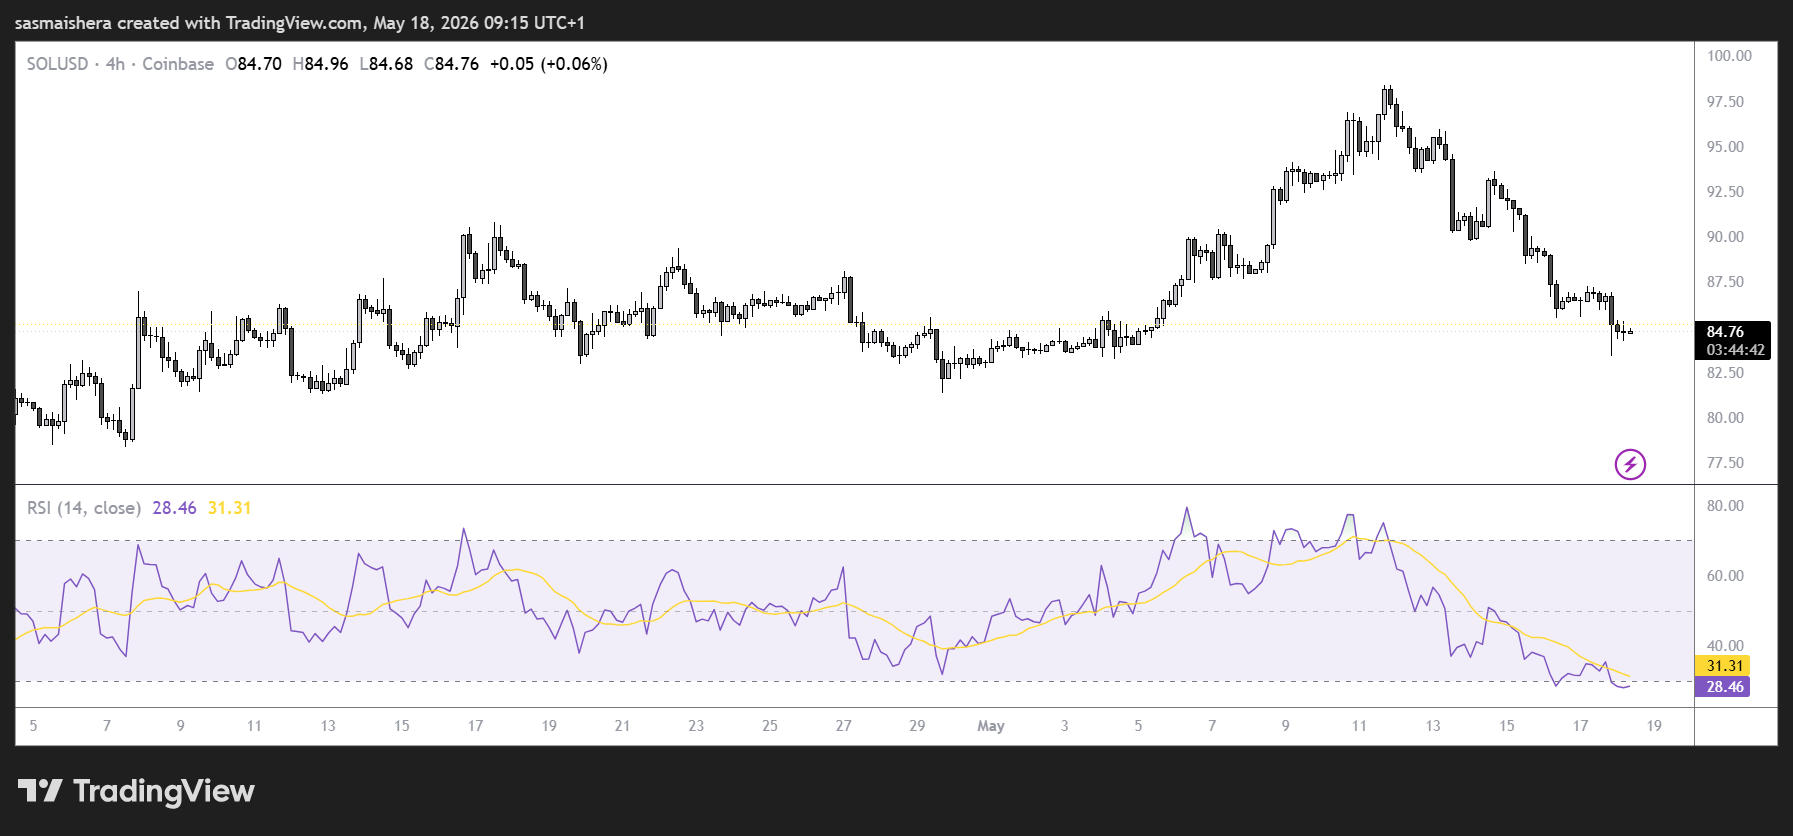
The SOL/USD 4-hour chart is bearish as Solana trades below all major moving averages.
SOL is currently trading beneath the 50-day Exponential Moving Average (EMA) at $87.90, while the 100-day EMA at $93.26 and the 200-day EMA at $108.51 remain significantly higher, reinforcing downward pressure on price action.
The current price action suggests the path of least resistance remains lower, with the next major support zone sitting between $77.60 and $75.63 — levels that previously acted as support during the February 5 and February 24 lows.
Furthermore, the momentum indicators favor sellers. The Relative Strength Index (RSI) hovers near 40, indicating that Solana is now in the oversold territory.
Meanwhile, the Moving Average Convergence Divergence (MACD) indicator crossed below its signal line on Saturday, confirming renewed downside momentum.
For bullish momentum to return, Solana would need to reclaim the 50-day EMA at $87.90 and close the daily candle above this level.
A successful breakout above that level could trigger an extended rally toward the 100-day EMA near $93.26.
However, analysts expect the psychologically important $100 region to act as a strong supply zone and potentially cap any short-term recovery attempt before SOL can challenge the 200-day EMA near $108.51.
The post Can Solana hold $80 as ETF inflows fail to stop the latest selloff? appeared first on Invezz
In This News
Coins

$ 64.32K
+0.57%
$ 1.82K
+1.67%
$ 78.20
+0.36%1654073624197.png)
$ 77.99
+0.18%Predictions Markets
See what traders are focused on
Share:
In This News
Coins
$ 64.32K
+0.57%$ 1.82K
+1.67%$ 78.20
+0.36%$ 77.99
+0.18%Predictions Markets
See what traders are focused on
Share:
Read More

Solana’da 75 dolar desteği korunurken 90 ve 100 dolar direnci izlendi