Bitcoin LTH Supply Climbs Back To August 2025 Levels As 316K BTC Move Into Strong Hands

Share:
On-chain data shows Bitcoin long-term holder supply rose to 15.26 million BTC, up roughly 316,000 BTC in the past 30 days and back to August 2025 levels, with about 800,000 BTC moved off Coinbase that could cross the six‑month LTH threshold on May 23. Analysts view the LTH accumulation and a 25% rebound from recent lows as signs of resilience while price sits near $80,000 (above $76,000); a $70,000 support test is possible but a true crash would require breaking the 200‑week moving average, highlighting implications for crypto adoption and CEX-to-LTH flows.
Predictions Markets
See what traders are focused on

Bitcoin’s latest on-chain picture is beginning to look less like panic and more like patience. Data from CryptoQuant, highlighted by crypto analyst Darkfost, shows that long-term holder supply has climbed back to 15.26 million BTC, returning to a level last seen in August 2025.
The move comes at a sensitive point for Bitcoin, with the price still trying to build strength around $80,000 while traders are currently split between another breakdown and a recovery.
Long-Term Holders Add 316,000 BTC In 30 Days
On-chain data tracked by CryptoQuant shows that Bitcoin’s long-term holder (LTH) supply has recovered to 15.26 million BTC, levels last seen in August 2025. However, the most important detail in the CryptoQuant chart is not only that long-term holder supply is rising but also the speed of the increase in the past month.
LTH supply has grown by roughly 316,000 BTC over the past 30 days. That means more coins are aging into long-term holder status, which is a category used to identify investors who have held their Bitcoin for at least about six months and are less likely to react to short-term volatility.
As shown in the chart image below, the green bars representing the 30-day change in LTH supply have increased into positive territory in recent weeks, which is a distinct reversal from the red distribution phase that dominated late 2025.
At the end of November, the same 30-day metric showed a negative change of about 650,000 BTC, meaning a large amount of supply had moved out of long-term holder wallets during that period. That earlier phase coincided with a more vulnerable market structure as Bitcoin rolled over from its October 2025 all-time high and began a deeper correction.
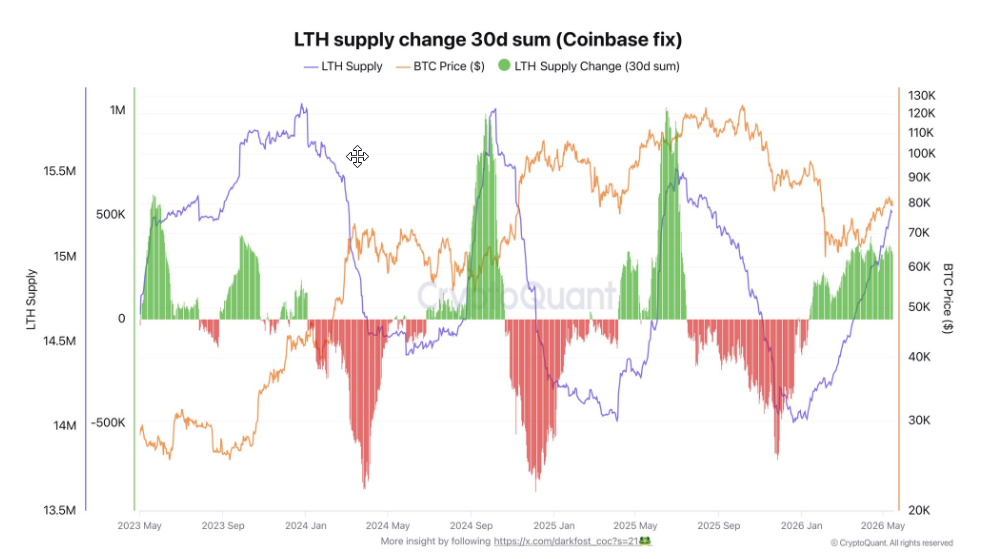
Darkfost also relayed this change to the earlier movement of 800,000 BTC from Coinbase. His point is that May 23 could become an important date for on-chain discussions, as those coins will officially cross the six-month threshold. Once that happens, then investors could see more commentary around how much of that supply is being reclassified into the hands of long-term holders.
Bitcoin Showing Strength
The long-term holder data also fits into a separate outlook from analyst Michaël van de Poppe, who noted that the market may be too focused on new lows. According to the analyst, Bitcoin’s 25% rebound from its recent lows, despite Middle East war concerns and a rise in yields, is a sign of resilience. In his argument, losing the 21-day moving average does not automatically mean Bitcoin must collapse into new lows, especially since the price is still holding above $76,000.
Van de Poppe also compared Bitcoin against gold, saying the BTC/gold RSI has fallen to one of its lowest readings ever. However, previous low readings in the BTC/gold RSI did not happen during the start of a bear market but came during the beginning of stronger Bitcoin phases.
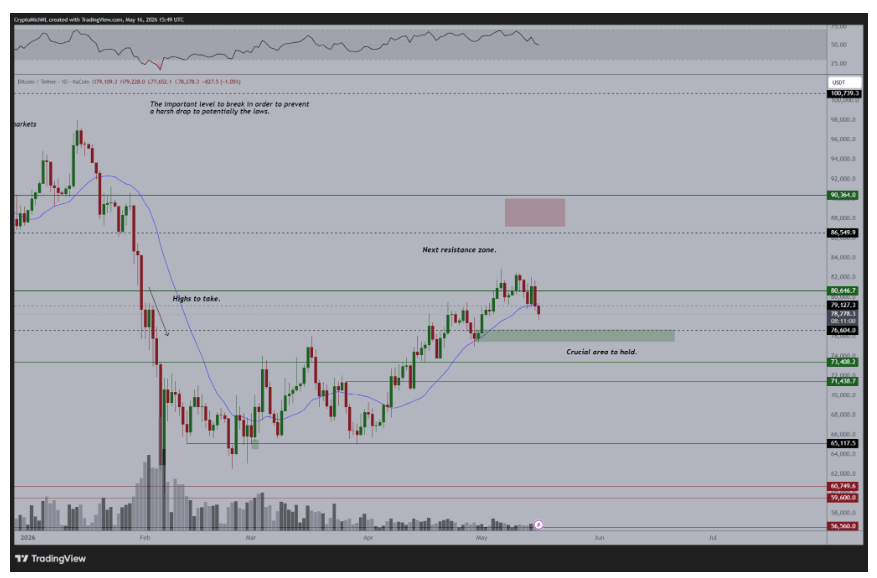
Bitcoin Price Chart. Source: @CryptoMichNL On X
A crash to new lows would require Bitcoin to invalidate the 200-week moving average, something that would break most cycle behavior outside extreme shocks such as the Luna and FTX collapses in 2022.
This does not mean that Bitcoin cannot test lower support. A move to $70,000 could still happen as a support test, but the difference is that he does not see new lows as the most likely outcome.
Featured image from Unsplash, chart from TradingView


Read More

Standard Chartered Maintains $100,000 Bitcoin Forecast for End of 2026