Ripple Price Analysis: XRP Bear Trend Continues – Is a Drop to $1.20 Inevitable?
Share:
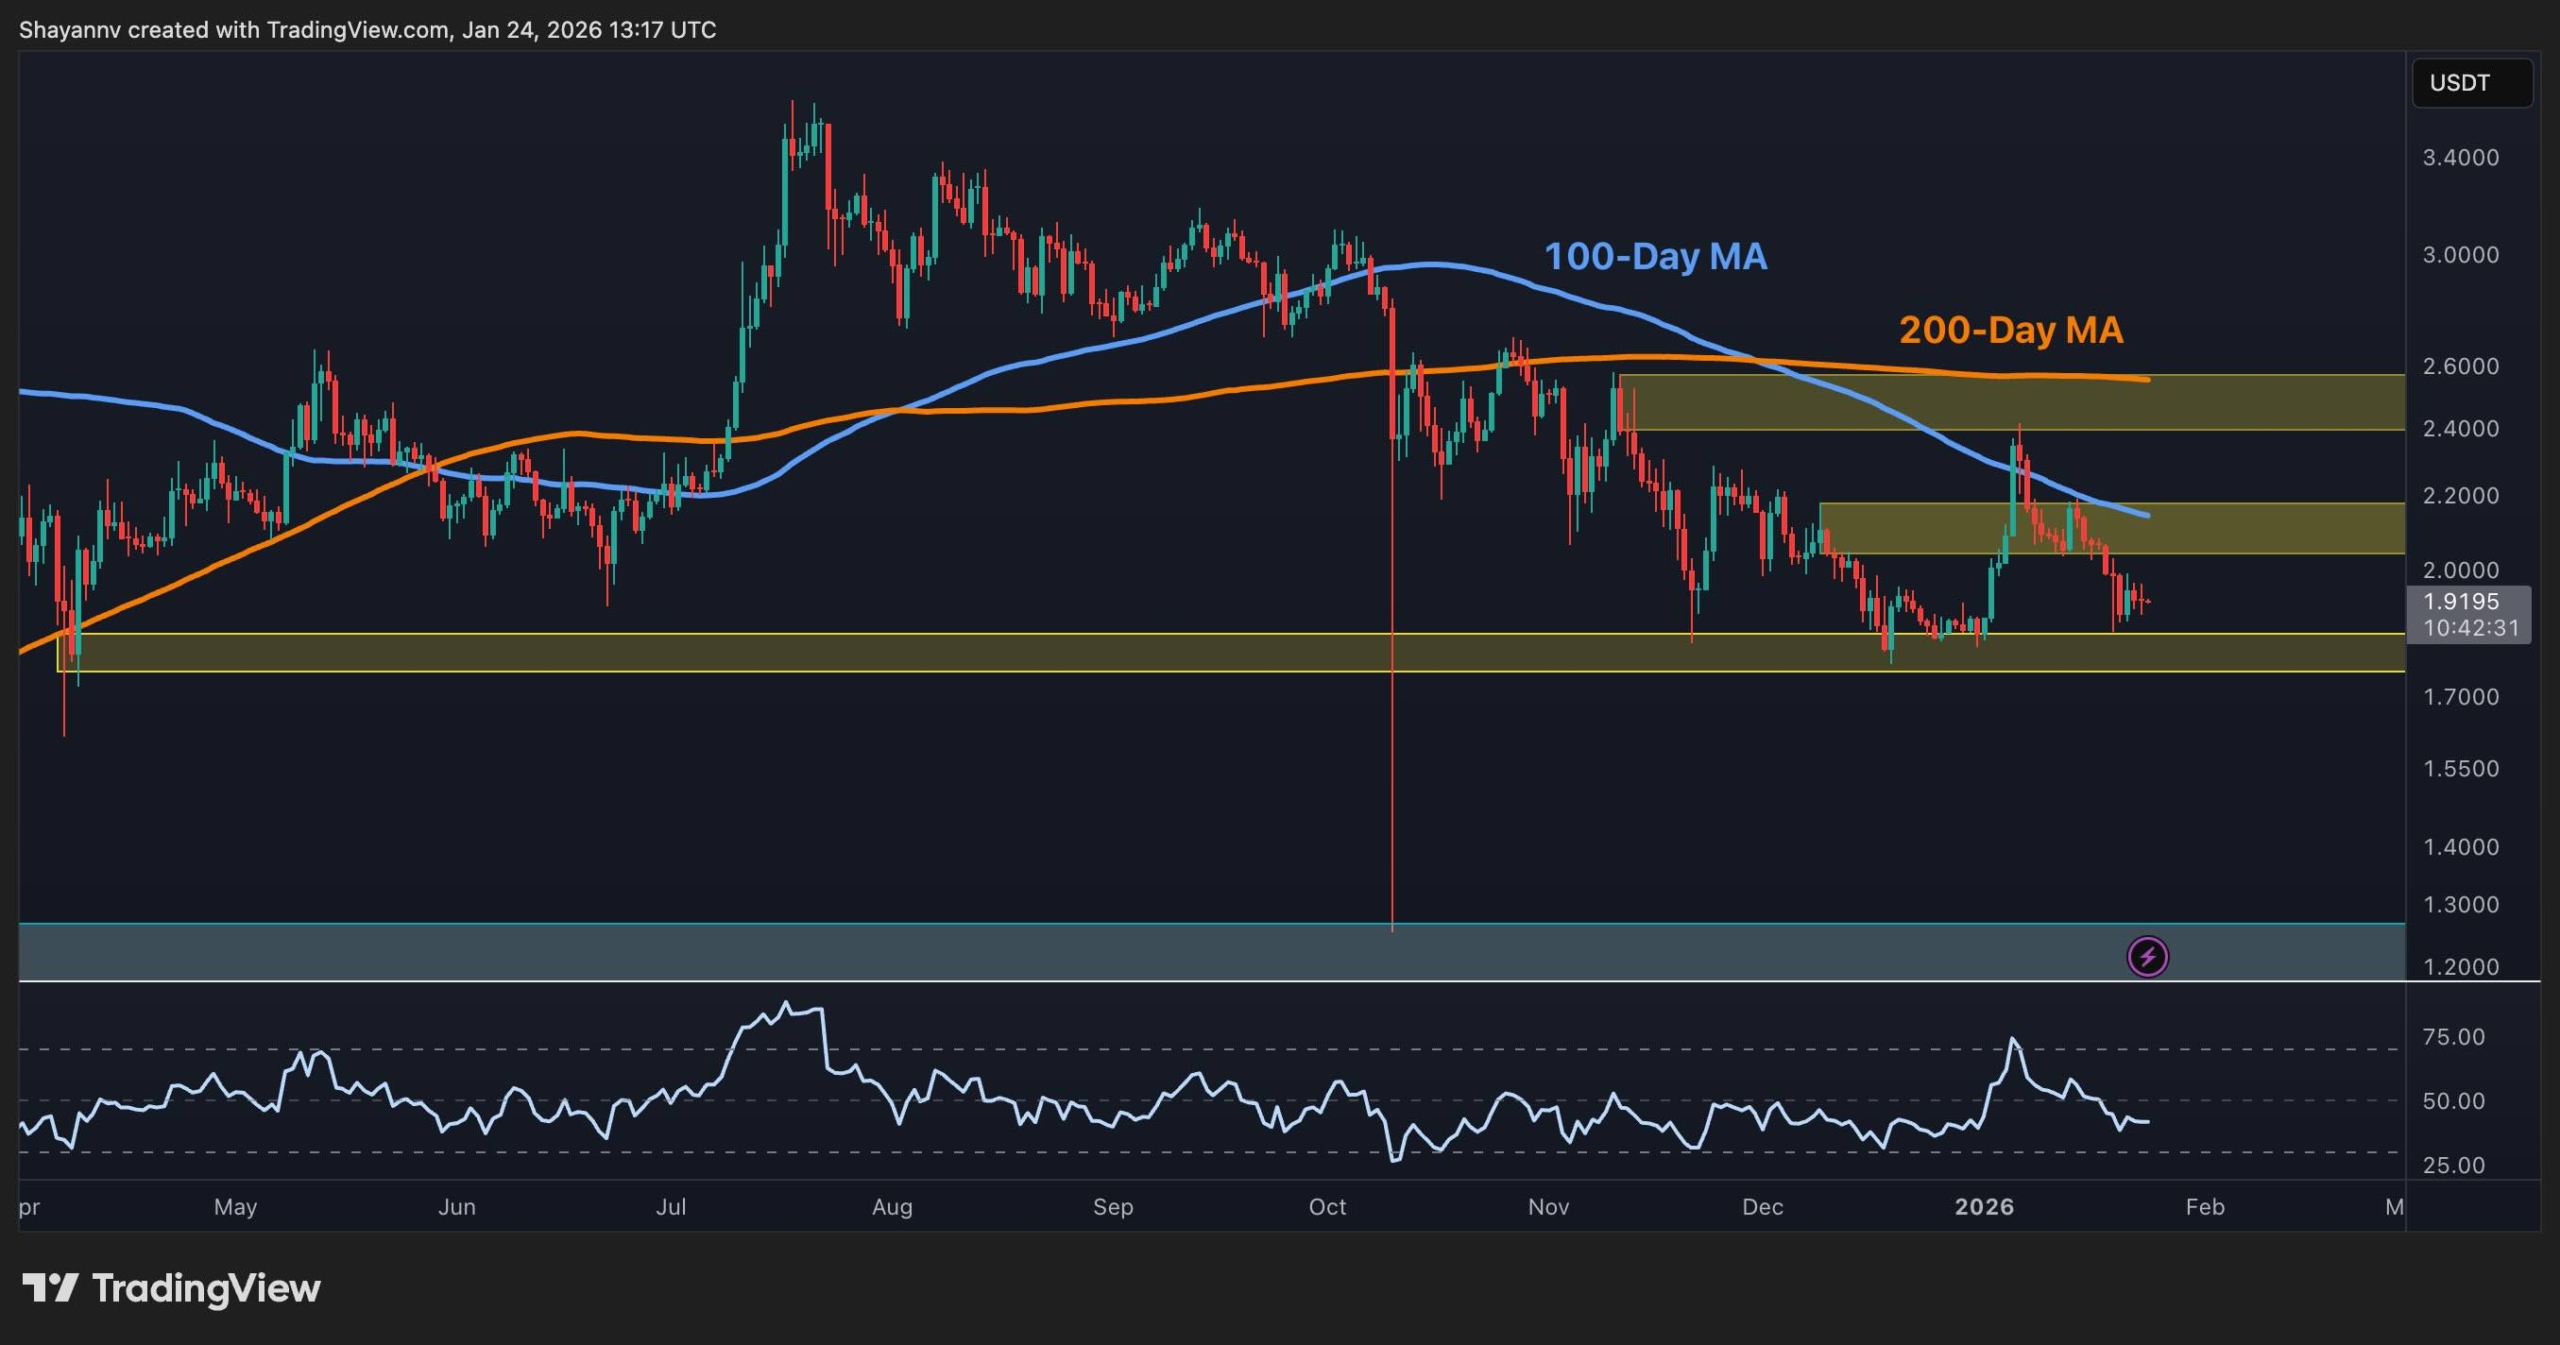
XRP is experiencing a corrective phase, testing key resistance levels above $1.80–$1.90 after being rejected at $2.40. The 100-day and 200-day moving averages are trending lower, indicating a medium-term bearish outlook. Daily RSI shows a return to neutral, reflecting a loss of recent momentum.
Predictions Markets
See what traders are focused on

XRP remains in a corrective phase across both USD and BTC pairs, with recent strength fading back into established resistance and trend filters. The price action is now testing whether the early-January rebound was merely a short-covering rally within a broader downtrend or the start of a more durable base.
Ripple Price Analysis: The USDT Pair
On the daily chart, XRP/USDT is trading just above the major horizontal demand zone around $1.80–$1.90 after being rejected from the $2.40 supply band and the declining 100-day and 200-day moving averages. The moving averages continue to slope lower, confirming a medium-term bearish bias, while daily RSI has cooled from overbought levels back toward neutral, consistent with a fading bounce.


Read More

Ripple yöneticilerine şirketten vazgeçmeleri tavsiye edildi