Tron Price Prediction: TRX Could Outperform Bitcoin And Surge 10%

Share:
Predictions Markets
See what traders are focused on

Tron price is holding gains above the $0.1050 support against the US Dollar. TRX is outperforming Bitcoin and could rise further above $0.1105.
- Tron is moving higher above the $0.1050 resistance level against the US dollar.
- The price is trading above $0.1065 and the 100 simple moving average (4 hours).
- There is a key rising channel forming with support at $0.1052 on the 4-hour chart of the TRX/USD pair (data source from Kraken).
- The pair could continue to climb higher toward $0.1105 or even $0.1200.
Tron Price Regains Strength
Recently, Bitcoin and Ethereum saw a major drop below $43,500 and $2,200. However, Tron price remained stable above the $0.1000 support. TRX formed a base above $0.1020 and started a fresh increase.
There was a move above the $0.1050 and $0.1055 resistance levels. The bulls pushed it above the 50% Fib retracement level of the downward move from the $0.1059 swing high to the $0.1028 low. TRX is now trading above $0.1065 and the 100 simple moving average (4 hours).
There is also a key rising channel forming with support at $0.1052 on the 4-hour chart of the TRX/USD pair. The current price action suggests more upsides.
On the upside, an initial resistance is near the $0.1088 level. It is near the 76.4% Fib retracement level of the downward move from the $0.1059 swing high to the $0.1028 low. The first major resistance is near $0.1105, above which the price could accelerate higher.
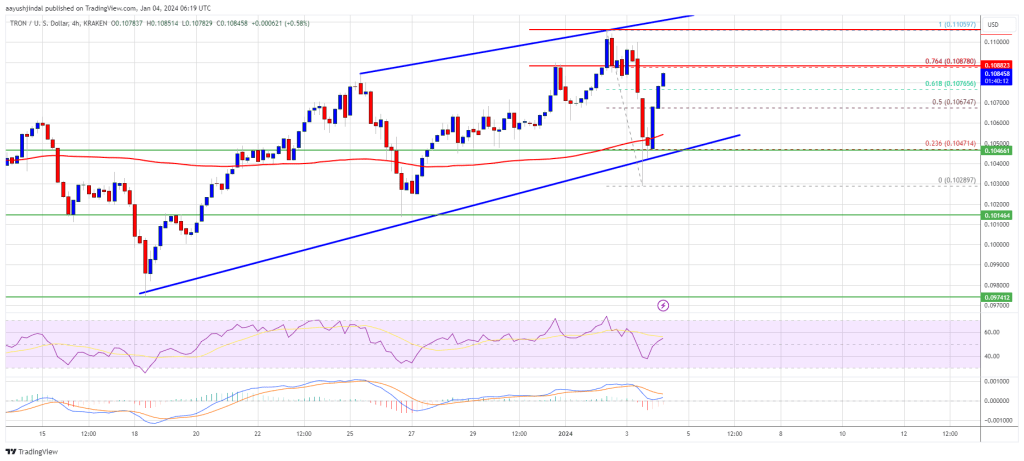
Source: TRXUSD on TradingView.com
The next resistance is near $0.1150. A close above the $0.1150 resistance might send TRX further higher toward $0.1200. The next major resistance is near the $0.1124 level, above which the bulls are likely to aim for a larger increase toward $0.1320.
Are Dips Limited in TRX?
If TRX price fails to clear the $0.1105 resistance, it could start a downside correction. Initial support on the downside is near the $0.1065 zone.
The first major support is near the $0.1050 level or the trend line, below which it could test $0.1020. Any more losses might send Tron toward the $0.0975 support in the coming sessions.
Technical Indicators
4 hours MACD – The MACD for TRX/USD is gaining momentum in the bullish zone.
4 hours RSI (Relative Strength Index) – The RSI for TRX/USD is currently above the 50 level.
Major Support Levels – $0.1065, $0.1050, and $0.0975.
Major Resistance Levels – $0.1088, $0.1105, and $0.1150.
In This News
Coins

$ 63.80K
+1.03%
$ 1.79K
+2.24%
$ 0.331
-0.32%
$ 0.00...361

$ 0.000207


Predictions Markets
See what traders are focused on
Share:
In This News
Coins
$ 63.80K
+1.03%$ 1.79K
+2.24%$ 0.331
-0.32%$ 0.00...361
$ 0.000207
Predictions Markets
See what traders are focused on
Share:
Read More

3 Altcoins That Could Reach All-Time Highs This Weekend, July 11-12