Why Is Crypto Down Today? – September 22, 2025

Share:
The crypto market is down today, with the global market cap falling by 3.8% to $3.97 trillion. Trading volume, however, is up, reaching $190.3 billion. Most major assets are in the red over the past 24 hours, with only a few exceptions among top coins.
TLDR:
- 9 of the top 10 cryptos are in the red;
- BTC down 2.7% to $112,508, ETH drops 6.7% to $4,166;
- Fear & Greed Index at 47 shows neutral sentiment;
- Bitunix warns Trump’s $100K H-1B visa fee may fuel volatility across markets;
- US BTC spot ETFs saw $222.62M in inflows;
- US ETH spot ETFs gained $47.75M;
- China urged brokerages to pause RWA tokenization in Hong Kong amid regulatory caution;
Crypto Winners & Losers
At the time of writing, nine of the top 10 cryptocurrencies by market cap are showing 24-hour losses.
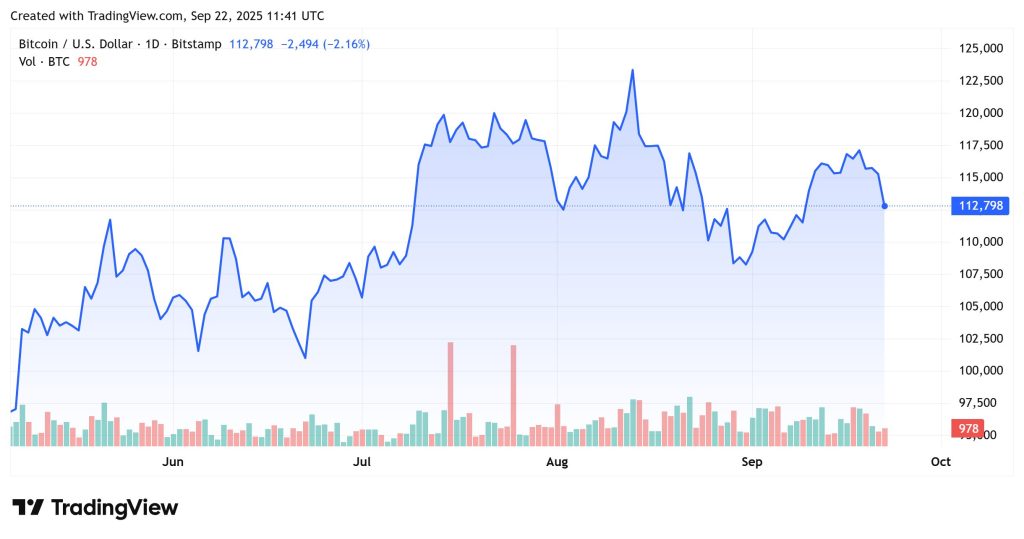
Bitcoin (BTC) is trading at $112,508, down 2.7% in the last 24 hours, but still up 2% over the past week.
Ethereum (ETH) has dropped 6.7% on the day to $4,166.40, marking one of the steeper declines in the top 10.
Dogecoin (DOGE) leads the losses, falling 10.7% to $0.238, with a 7-day drop of nearly 10%.
BNB (BNB) is the only coin among the top five posting green on the weekly chart, up 11.1% over the past 7 days despite a 3.9% drop in the last 24 hours.
Among trending tokens, OG saw a massive drop of 26.8% to $4.31, followed by Aster, down 15.1% to $1.46. Avantis also slipped 3.6% to $2.07.
Top gainers include PumpBTC, which surged 140.9% to $0.2175, followed by Merlin Chain up 46.8% to $0.373, and Mavryk Network rising 30.6% to $0.1436.
Despite short-term losses across much of the market, some altcoins continue to show outsized volatility, both to the upside and downside.
Meanwhile, with October just days away, analysts are debating whether Bitcoin will repeat its strong historical performance, as it has closed in the green 10 out of the past 12 Octobers, earning the nickname “Uptober.” A rally similar to 2017 or 2021 could push BTC to around $165,000 from current levels.
Trump’s H-1B Fee Bomb Sparks Crypto Jitters
Bitunix analysts say President Donald Trump’s proposed $100,000 H-1B visa fee has rattled markets, injecting fresh political risk into an already fragile macro environment.
The move directly targets India’s $280 billion IT outsourcing sector, raising the prospect of trade tensions, legal battles, and rising corporate costs.
“This policy is highly political and will likely spark negotiations and litigation between corporations and governments,” the analysts wrote, warning that weakened risk appetite could drive capital toward safer assets like the US dollar and Treasuries.
In crypto, BTC slipped from ~$117,000 to around $114,000, with buyers reappearing near $113,000. “If $111,000 breaks, price may quickly fall toward secondary support at $108,000,” Bitunix said.
Resistance remains heavy near $119,000–$120,500, where liquidity heatmaps show dense short-term seller clusters.
Traders are advised to monitor US–India developments and reactions from major tech firms. Until clarity emerges, volatility could remain elevated across both traditional and digital markets.
Levels & Events to Watch Next
As of Monday morning, Bitcoin is trading at $112,594, down 2.6% over the past 24 hours. After failing to reclaim the $115K zone, BTC has slipped into a lower range, with buyers stepping in around $112K. The asset remains under pressure, consolidating below the $114K resistance.
Traders are closely watching the $114,000–$116,000 zone. A clean break above could open the door toward $117,500, with $119,000 as the next upside level. On the downside, $111,000 is the next key support, followed by $108,000 if the level breaks with volume.
Meanwhile, Ethereum is trading at $4,166, down 6.6% on the day. ETH saw a sharp rejection after briefly touching the $4,500 mark over the weekend and has since pulled back toward its lower support levels.
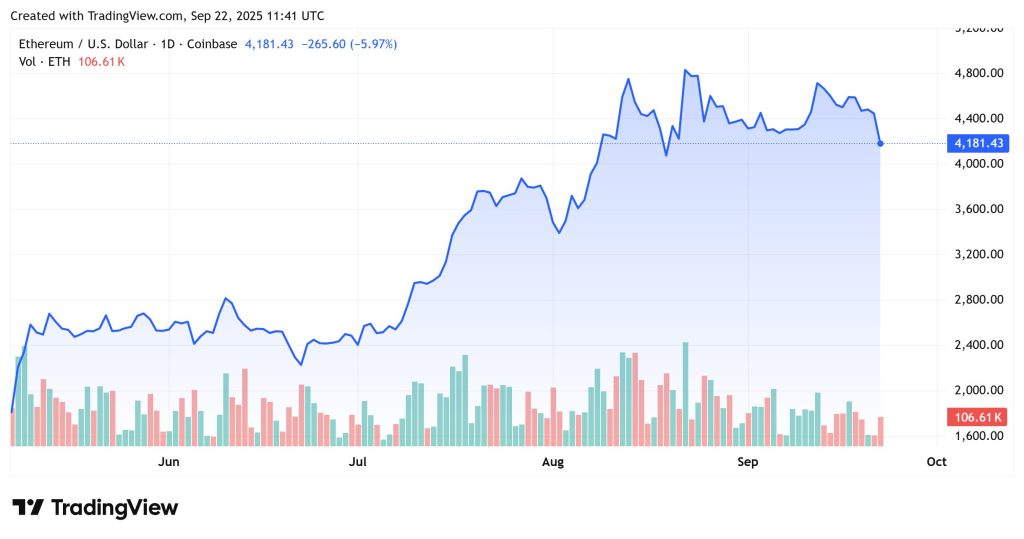
Immediate resistance sits at $4,300, followed by a stronger zone at $4,500–$4,600. If ETH fails to hold the $4,150–$4,100 range, further downside could test $3,950, with $3,800 acting as the next major support.
Market participants are eyeing macro risks, including US tech-sector volatility and regulatory signals out of Asia, both of which could fuel more choppy price action this week.
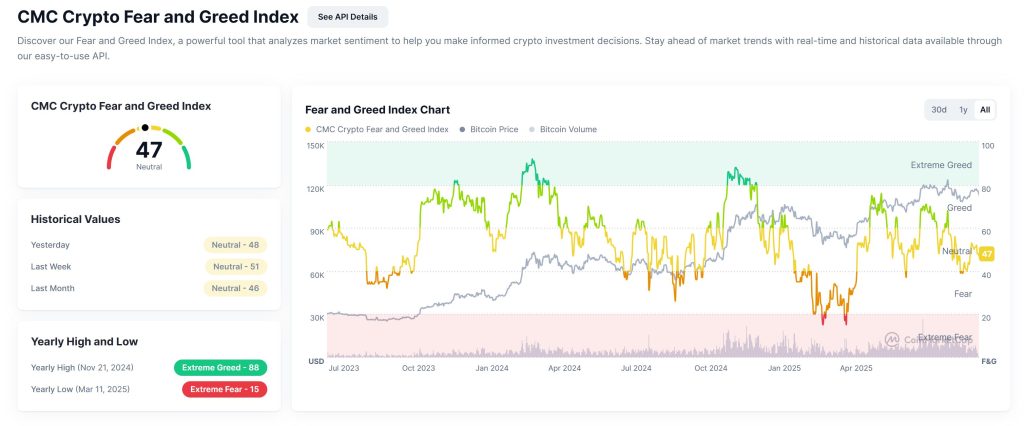
Meanwhile, market sentiment in crypto remains steady. The CMC Crypto Fear and Greed Index is currently at 47, slightly lower than yesterday’s 48 and down from last week’s 51, signaling a continued neutral outlook.
This reading suggests that traders remain cautious, neither driven by fear nor swept up in market euphoria. With Bitcoin ranging below key resistance and macro risks still present, participants appear to be waiting on clearer direction before making decisive moves.
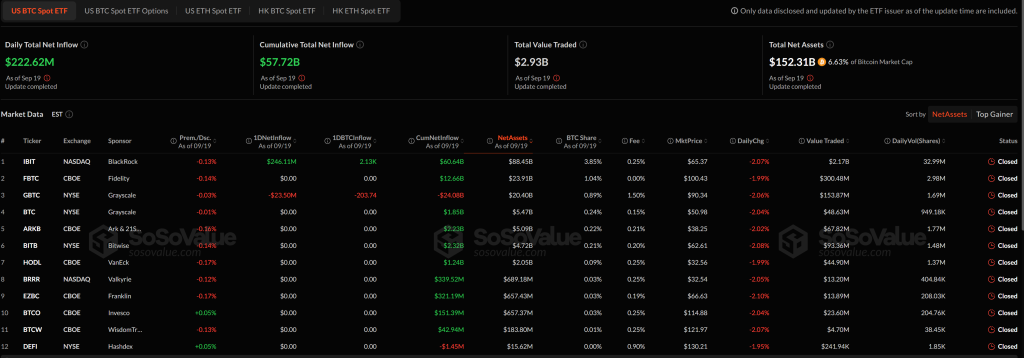
The US Bitcoin spot ETFs recorded a strong day of inflows on September 19, adding $222.62 million in net new capital. This pushes the cumulative net inflow across all funds to $57.72 billion, with total assets under management now reaching $152.31 billion, or 6.63% of Bitcoin’s total market cap.
BlackRock’s IBIT led the day with a massive $246.11 million in net inflows, the only fund to post a gain. Grayscale’s GBTC saw the largest outflow, losing $23.5 million and shedding 203.74 BTC.
Other funds, including FBTC, BITB, ARKB, and HODL, recorded no net flows for the day, showing a largely one-sided flow pattern. Trading volume was dominated by IBIT at $2.17 billion, followed by FBTC and GBTC.
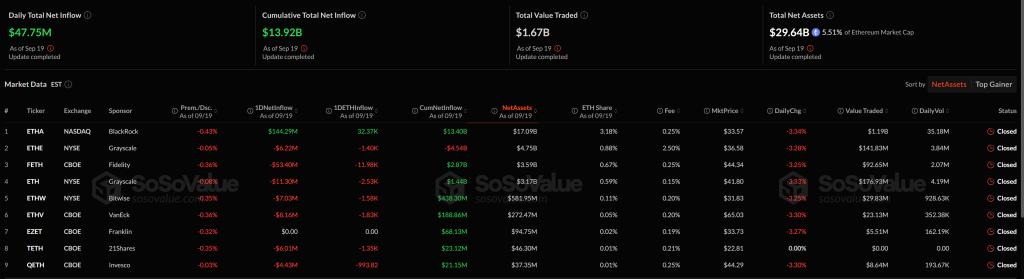
The US Ethereum spot ETFs recorded net inflows of $47.75 million on September 19, bringing the cumulative total net inflow across all ETH funds to $13.92 billion. Total assets under management now stand at $29.64 billion, or 5.51% of Ethereum’s market cap.
Among the nine listed ETFs, BlackRock’s ETHA led with a significant $144.29 million in net inflows, followed by smaller outflows from other funds. Fidelity’s FETH recorded a notable outflow of $53.40 million, while Grayscale’s ETH and ETHE saw outflows of $11.30 million and $6.22 million, respectively.
Meanwhile, China’s securities regulator has quietly urged domestic brokerages to halt their real-world asset (RWA) tokenization operations in Hong Kong, raising red flags over the fast-growing digital assets sector being cultivated offshore.
— Cryptonews.com (@cryptonews) September 22, 2025
China’s securities regulator is quietly urging domestic brokerages to halt their real-world asset (RWA) tokenization operations in Hong Kong.#RWA #Chinahttps://t.co/wPU4yuNGRK
Quick FAQ
1. Why did crypto move against stocks today?
The crypto market has decreased over the past day, while the stock market increased on its previous day of trading, rising to record highs. By the closing time on Friday, the S&P 500 was up by 0.49%, the Nasdaq-100 increased by 0.70%, and the Dow Jones Industrial Average rose 0.37%.
The post Why Is Crypto Down Today? – September 22, 2025 appeared first on Cryptonews.
In This News
Coins

$ 84.42K
-1.44%
$ 0.211
-2.11%
$ 2.75K
-1.87%
$ 836.65
-2.88%
$ 0.0149
-3.49%


Share:
In This News
Coins
$ 84.42K
-1.44%$ 0.211
-2.11%$ 2.75K
-1.87%$ 836.65
-2.88%$ 0.0149
-3.49%Share:
Read More

How $14M in spot buys could save DASH’s price after falling by 17%

Stocks Rebound on Renewed Rate Cut Hopes, Will Crypto Market Follow?
Why Is Crypto Down Today? – September 22, 2025
Share:
The crypto market is down today, with the global market cap falling by 3.8% to $3.97 trillion. Trading volume, however, is up, reaching $190.3 billion. Most major assets are in the red over the past 24 hours, with only a few exceptions among top coins.
TLDR:
- 9 of the top 10 cryptos are in the red;
- BTC down 2.7% to $112,508, ETH drops 6.7% to $4,166;
- Fear & Greed Index at 47 shows neutral sentiment;
- Bitunix warns Trump’s $100K H-1B visa fee may fuel volatility across markets;
- US BTC spot ETFs saw $222.62M in inflows;
- US ETH spot ETFs gained $47.75M;
- China urged brokerages to pause RWA tokenization in Hong Kong amid regulatory caution;
Crypto Winners & Losers
At the time of writing, nine of the top 10 cryptocurrencies by market cap are showing 24-hour losses.
Bitcoin (BTC) is trading at $112,508, down 2.7% in the last 24 hours, but still up 2% over the past week.
Ethereum (ETH) has dropped 6.7% on the day to $4,166.40, marking one of the steeper declines in the top 10.
Dogecoin (DOGE) leads the losses, falling 10.7% to $0.238, with a 7-day drop of nearly 10%.
BNB (BNB) is the only coin among the top five posting green on the weekly chart, up 11.1% over the past 7 days despite a 3.9% drop in the last 24 hours.
Among trending tokens, OG saw a massive drop of 26.8% to $4.31, followed by Aster, down 15.1% to $1.46. Avantis also slipped 3.6% to $2.07.
Top gainers include PumpBTC, which surged 140.9% to $0.2175, followed by Merlin Chain up 46.8% to $0.373, and Mavryk Network rising 30.6% to $0.1436.
Despite short-term losses across much of the market, some altcoins continue to show outsized volatility, both to the upside and downside.
Meanwhile, with October just days away, analysts are debating whether Bitcoin will repeat its strong historical performance, as it has closed in the green 10 out of the past 12 Octobers, earning the nickname “Uptober.” A rally similar to 2017 or 2021 could push BTC to around $165,000 from current levels.
Trump’s H-1B Fee Bomb Sparks Crypto Jitters
Bitunix analysts say President Donald Trump’s proposed $100,000 H-1B visa fee has rattled markets, injecting fresh political risk into an already fragile macro environment.
The move directly targets India’s $280 billion IT outsourcing sector, raising the prospect of trade tensions, legal battles, and rising corporate costs.
“This policy is highly political and will likely spark negotiations and litigation between corporations and governments,” the analysts wrote, warning that weakened risk appetite could drive capital toward safer assets like the US dollar and Treasuries.
In crypto, BTC slipped from ~$117,000 to around $114,000, with buyers reappearing near $113,000. “If $111,000 breaks, price may quickly fall toward secondary support at $108,000,” Bitunix said.
Resistance remains heavy near $119,000–$120,500, where liquidity heatmaps show dense short-term seller clusters.
Traders are advised to monitor US–India developments and reactions from major tech firms. Until clarity emerges, volatility could remain elevated across both traditional and digital markets.
Levels & Events to Watch Next
As of Monday morning, Bitcoin is trading at $112,594, down 2.6% over the past 24 hours. After failing to reclaim the $115K zone, BTC has slipped into a lower range, with buyers stepping in around $112K. The asset remains under pressure, consolidating below the $114K resistance.
Traders are closely watching the $114,000–$116,000 zone. A clean break above could open the door toward $117,500, with $119,000 as the next upside level. On the downside, $111,000 is the next key support, followed by $108,000 if the level breaks with volume.
Meanwhile, Ethereum is trading at $4,166, down 6.6% on the day. ETH saw a sharp rejection after briefly touching the $4,500 mark over the weekend and has since pulled back toward its lower support levels.
Immediate resistance sits at $4,300, followed by a stronger zone at $4,500–$4,600. If ETH fails to hold the $4,150–$4,100 range, further downside could test $3,950, with $3,800 acting as the next major support.
Market participants are eyeing macro risks, including US tech-sector volatility and regulatory signals out of Asia, both of which could fuel more choppy price action this week.
Meanwhile, market sentiment in crypto remains steady. The CMC Crypto Fear and Greed Index is currently at 47, slightly lower than yesterday’s 48 and down from last week’s 51, signaling a continued neutral outlook.
This reading suggests that traders remain cautious, neither driven by fear nor swept up in market euphoria. With Bitcoin ranging below key resistance and macro risks still present, participants appear to be waiting on clearer direction before making decisive moves.
The US Bitcoin spot ETFs recorded a strong day of inflows on September 19, adding $222.62 million in net new capital. This pushes the cumulative net inflow across all funds to $57.72 billion, with total assets under management now reaching $152.31 billion, or 6.63% of Bitcoin’s total market cap.
BlackRock’s IBIT led the day with a massive $246.11 million in net inflows, the only fund to post a gain. Grayscale’s GBTC saw the largest outflow, losing $23.5 million and shedding 203.74 BTC.
Other funds, including FBTC, BITB, ARKB, and HODL, recorded no net flows for the day, showing a largely one-sided flow pattern. Trading volume was dominated by IBIT at $2.17 billion, followed by FBTC and GBTC.
The US Ethereum spot ETFs recorded net inflows of $47.75 million on September 19, bringing the cumulative total net inflow across all ETH funds to $13.92 billion. Total assets under management now stand at $29.64 billion, or 5.51% of Ethereum’s market cap.
Among the nine listed ETFs, BlackRock’s ETHA led with a significant $144.29 million in net inflows, followed by smaller outflows from other funds. Fidelity’s FETH recorded a notable outflow of $53.40 million, while Grayscale’s ETH and ETHE saw outflows of $11.30 million and $6.22 million, respectively.
Meanwhile, China’s securities regulator has quietly urged domestic brokerages to halt their real-world asset (RWA) tokenization operations in Hong Kong, raising red flags over the fast-growing digital assets sector being cultivated offshore.
— Cryptonews.com (@cryptonews) September 22, 2025
Quick FAQ
1. Why did crypto move against stocks today?
The crypto market has decreased over the past day, while the stock market increased on its previous day of trading, rising to record highs. By the closing time on Friday, the S&P 500 was up by 0.49%, the Nasdaq-100 increased by 0.70%, and the Dow Jones Industrial Average rose 0.37%.
The post Why Is Crypto Down Today? – September 22, 2025 appeared first on Cryptonews.
In This News
Coins
$ 84.42K
-1.44%$ 0.211
-2.11%$ 2.75K
-1.87%$ 836.65
-2.88%$ 0.0149
-3.49%Share:
In This News
Coins
$ 84.42K
-1.44%$ 0.211
-2.11%$ 2.75K
-1.87%$ 836.65
-2.88%$ 0.0149
-3.49%Share:
Read More
How $14M in spot buys could save DASH’s price after falling by 17%