Bitcoin Price Confronts Major Technical Wall Around $107K, Momentum Starts to Slow

Share:
Predictions Markets
See what traders are focused on

Bitcoin price is attempting to recover above $105,500. BTC could continue to move up if it clears the $107,000 resistance zone.
- Bitcoin started a decent recovery wave above the $105,000 support.
- The price is trading above $105,000 and the 100 hourly Simple moving average.
- There is a bullish trend line forming with support at $104,000 on the hourly chart of the BTC/USD pair (data feed from Kraken).
- The pair might continue to move up if it settles above the $107,000 zone.
Bitcoin Price Faces Key Resistance
Bitcoin price managed to stay above the $102,000 support level and started a recovery wave. BTC recovered above the $103,500 and $104,200 resistance levels.
The pair even climbed above $105,500. Finally, it tested the $107,500 resistance zone. A high was formed at $107,400 and the price is now consolidating gains. There was a minor decline below the 23.6% Fib retracement level of the upward move from the $99,222 swing low to the $107,400 high.
Bitcoin is now trading above $105,000 and the 100 hourly Simple moving average. If the bulls attempt another recovery wave, the price could face resistance near the $106,600 level. The first key resistance is near the $107,000 level.
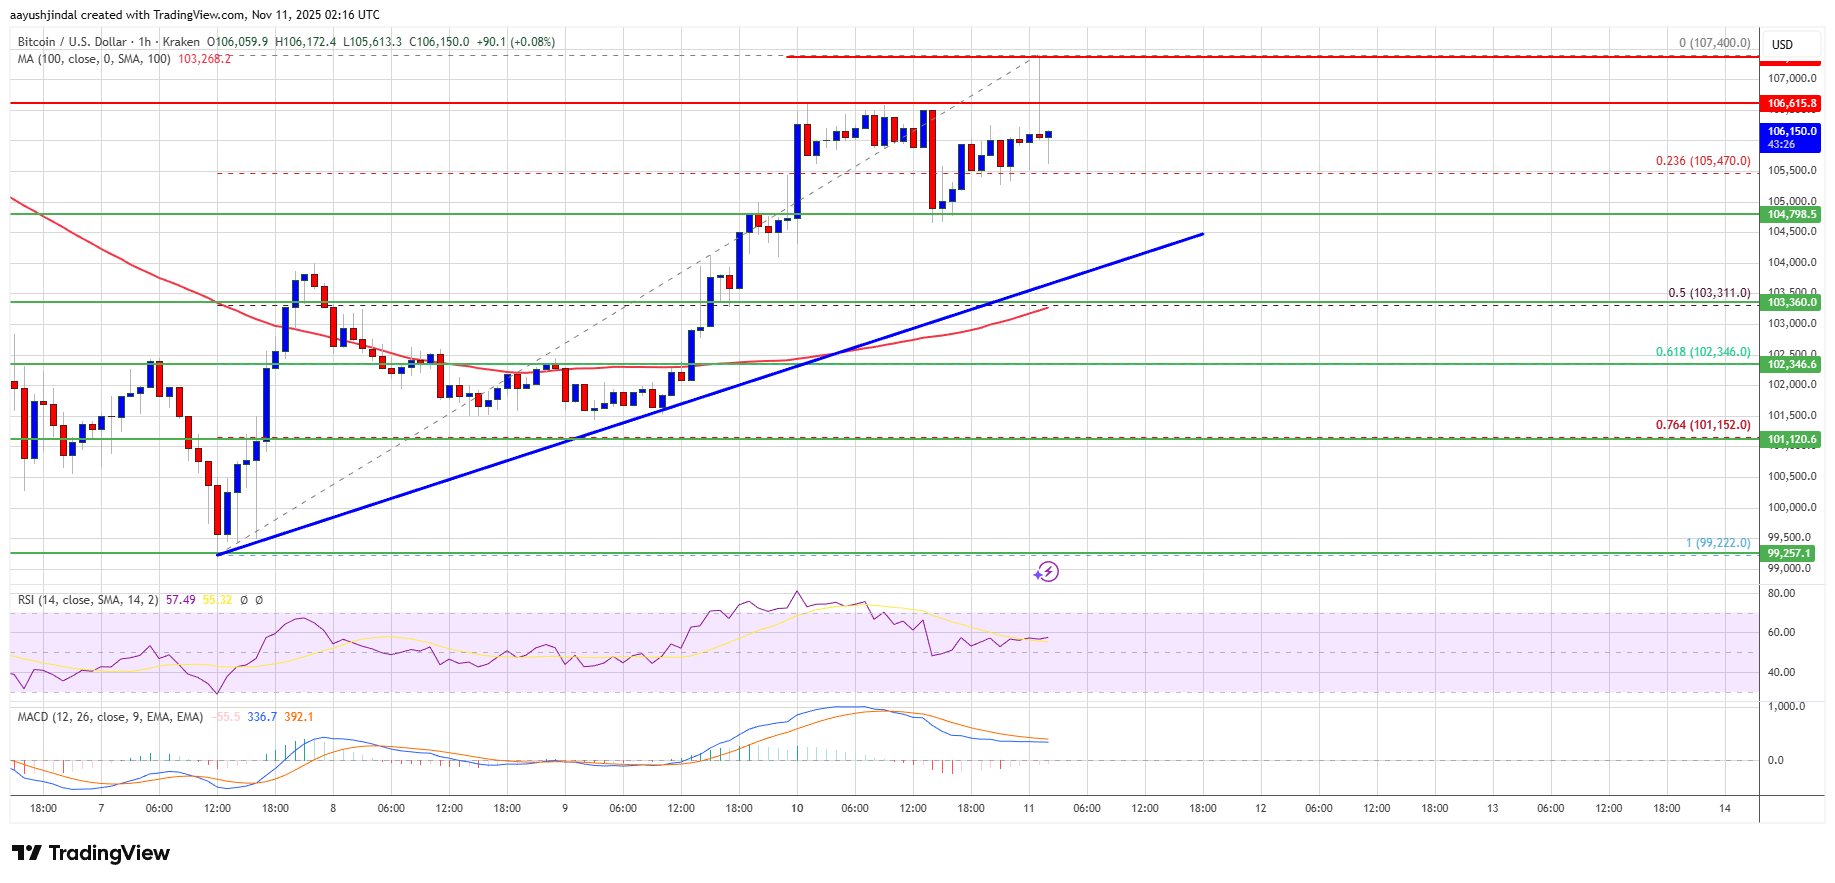
The next resistance could be $107,500. A close above the $107,500 resistance might send the price further higher. In the stated case, the price could rise and test the $108,000 resistance. Any more gains might send the price toward the $109,200 level. The next barrier for the bulls could be $109,800 and $110,500.
Another Decline In BTC?
If Bitcoin fails to rise above the $107,000 resistance zone, it could start another decline. Immediate support is near the $104,800 level. The first major support is near the $104,000 level and the trend line.
The next support is now near the $103,300 zone or the 50% Fib retracement level of the upward move from the $99,222 swing low to the $107,400 high. Any more losses might send the price toward the $102,350 support in the near term. The main support sits at $102,500, below which BTC might struggle to recover in the near term.
Technical indicators:
Hourly MACD – The MACD is now losing pace in the bullish zone.
Hourly RSI (Relative Strength Index) – The RSI for BTC/USD is now above the 50 level.
Major Support Levels – $104,850, followed by $104,000.
Major Resistance Levels – $106,500 and $107,000.
In This News
Coins

$ 78.51K
-1.20%
$ 0.0809
+0.06%
$ 0.00...361

$ 0.00643

$ 213.96


Predictions Markets
See what traders are focused on
Share:
In This News
Coins
$ 78.51K
-1.20%$ 0.0809
+0.06%$ 0.00...361
$ 0.00643
$ 213.96
Predictions Markets
See what traders are focused on
Share:
Read More

Bitcoin Must Reclaim This Level Soon or Risk Slide Toward $50K: Analyst