Bitcoin Faces Rejection — Resistance Zone Caps Upside After Recent Increase

Share:
Predictions Markets
See what traders are focused on

Bitcoin price is correcting gains below $113,500. BTC could continue to move down if it stays below the $114,200 resistance.
- Bitcoin started a downside correction below the $114,200 support.
- The price is trading below $114,000 and the 100 hourly Simple moving average.
- There was a break below a bullish trend line with support at $114,050 on the hourly chart of the BTC/USD pair (data feed from Kraken).
- The pair might continue to move down if it trades below the $112,000 zone.
Bitcoin Price Starts Pullback
Bitcoin price extended gains above the $113,500 zone. BTC gained pace for a move above the $115,000 pivot level. The price even spiked above $116,200 before the bears appeared.
A high was formed at $116,309 and the price is now correcting some gains. There was a move below the $114,200 support zone. The price dipped below the 23.6% Fib retracement level of the recent wave from the $106,718 swing low to the $116,309 high.
Moreover, there was a break below a bullish trend line with support at $114,050 on the hourly chart of the BTC/USD pair. Bitcoin is now trading below $114,000 and the 100 hourly Simple moving average.
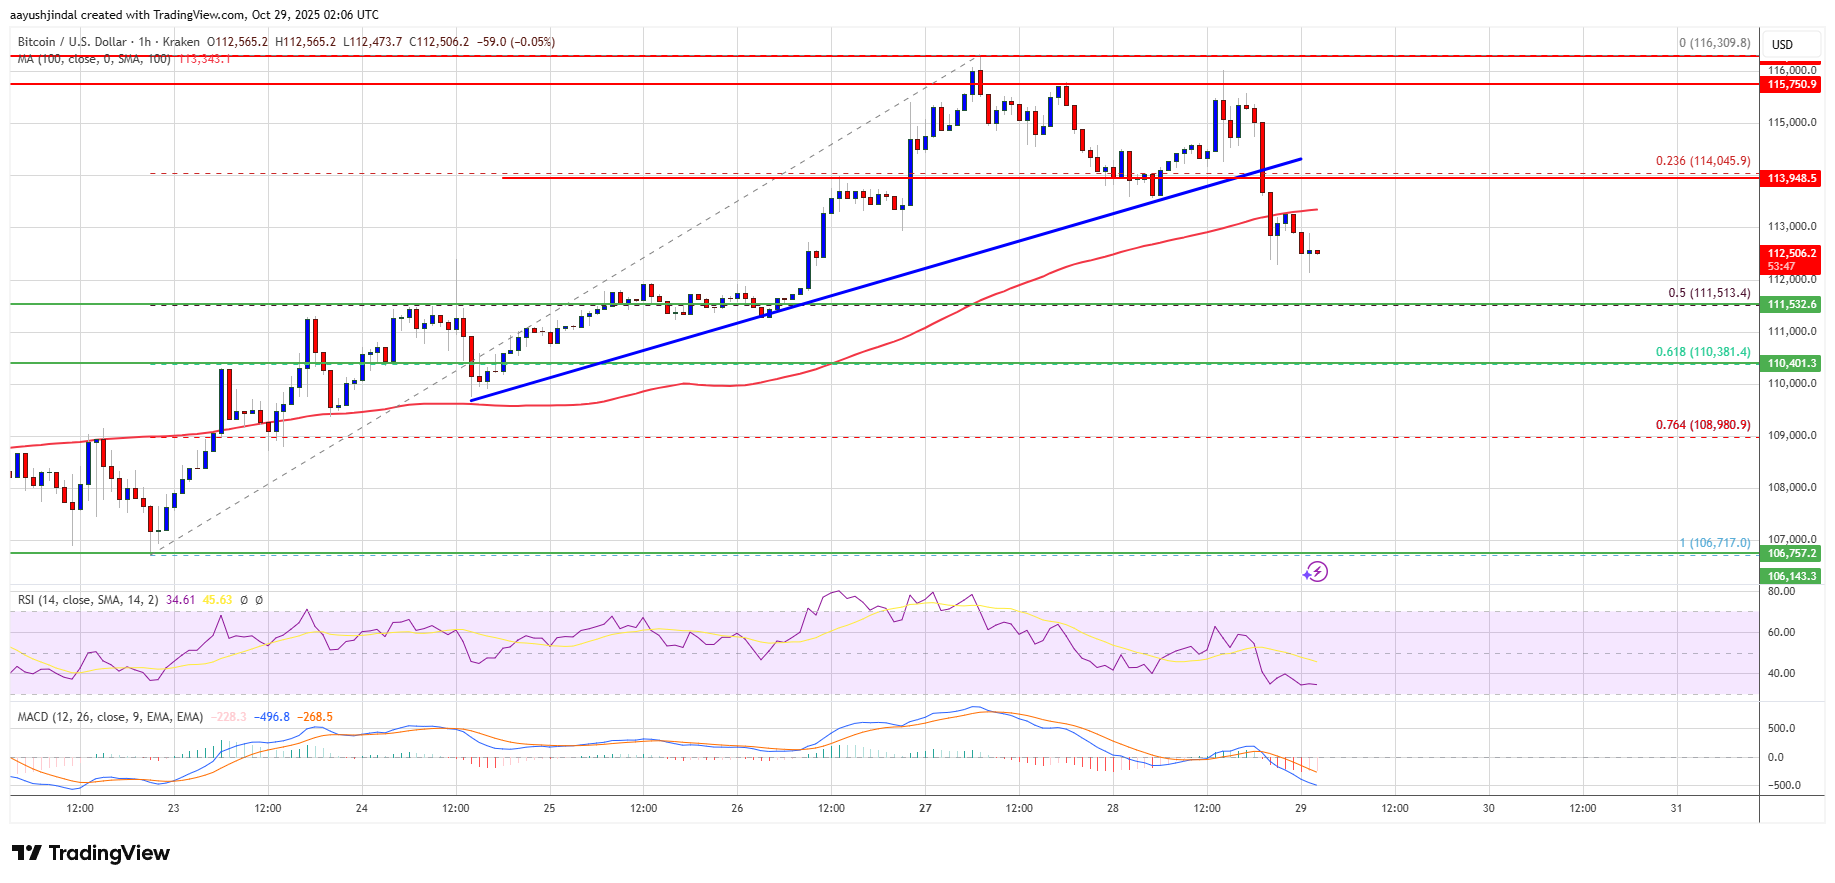
Immediate resistance on the upside is near the $113,650 level. The first key resistance is near the $114,200 level. The next resistance could be $115,000. A close above the $115,000 resistance might send the price further higher. In the stated case, the price could rise and test the $116,200 resistance. Any more gains might send the price toward the $117,500 level. The next barrier for the bulls could be $118,000.
More Losses In BTC?
If Bitcoin fails to rise above the $114,200 resistance zone, it could continue to move down. Immediate support is near the $112,000 level. The first major support is near the $111,500 level or the 50% Fib retracement level of the recent wave from the $106,718 swing low to the $116,309 high.
The next support is now near the $110,500 zone. Any more losses might send the price toward the $110,000 support in the near term. The main support sits at $108,500, below which BTC might struggle to recover in the short term.
Technical indicators:
Hourly MACD – The MACD is now gaining pace in the bearish zone.
Hourly RSI (Relative Strength Index) – The RSI for BTC/USD is now below the 50 level.
Major Support Levels – $112,000, followed by $111,500.
Major Resistance Levels – $114,200 and $115,000.
In This News
Coins

$ 62.59K
+0.80%
$ 0.0769
-1.20%
$ 0.00...361

$ 0.000207

$ 0.00...021


Predictions Markets
See what traders are focused on
Share:
In This News
Coins
$ 62.59K
+0.80%$ 0.0769
-1.20%$ 0.00...361
$ 0.000207
$ 0.00...021
Predictions Markets
See what traders are focused on
Share:
Read More

Trump Highlights Bitcoin’s Growing Influence: “People Don’t Realize How Powerful It Is”