XRP Price Downside Momentum Builds Amid Fading Recovery Hopes

Share:
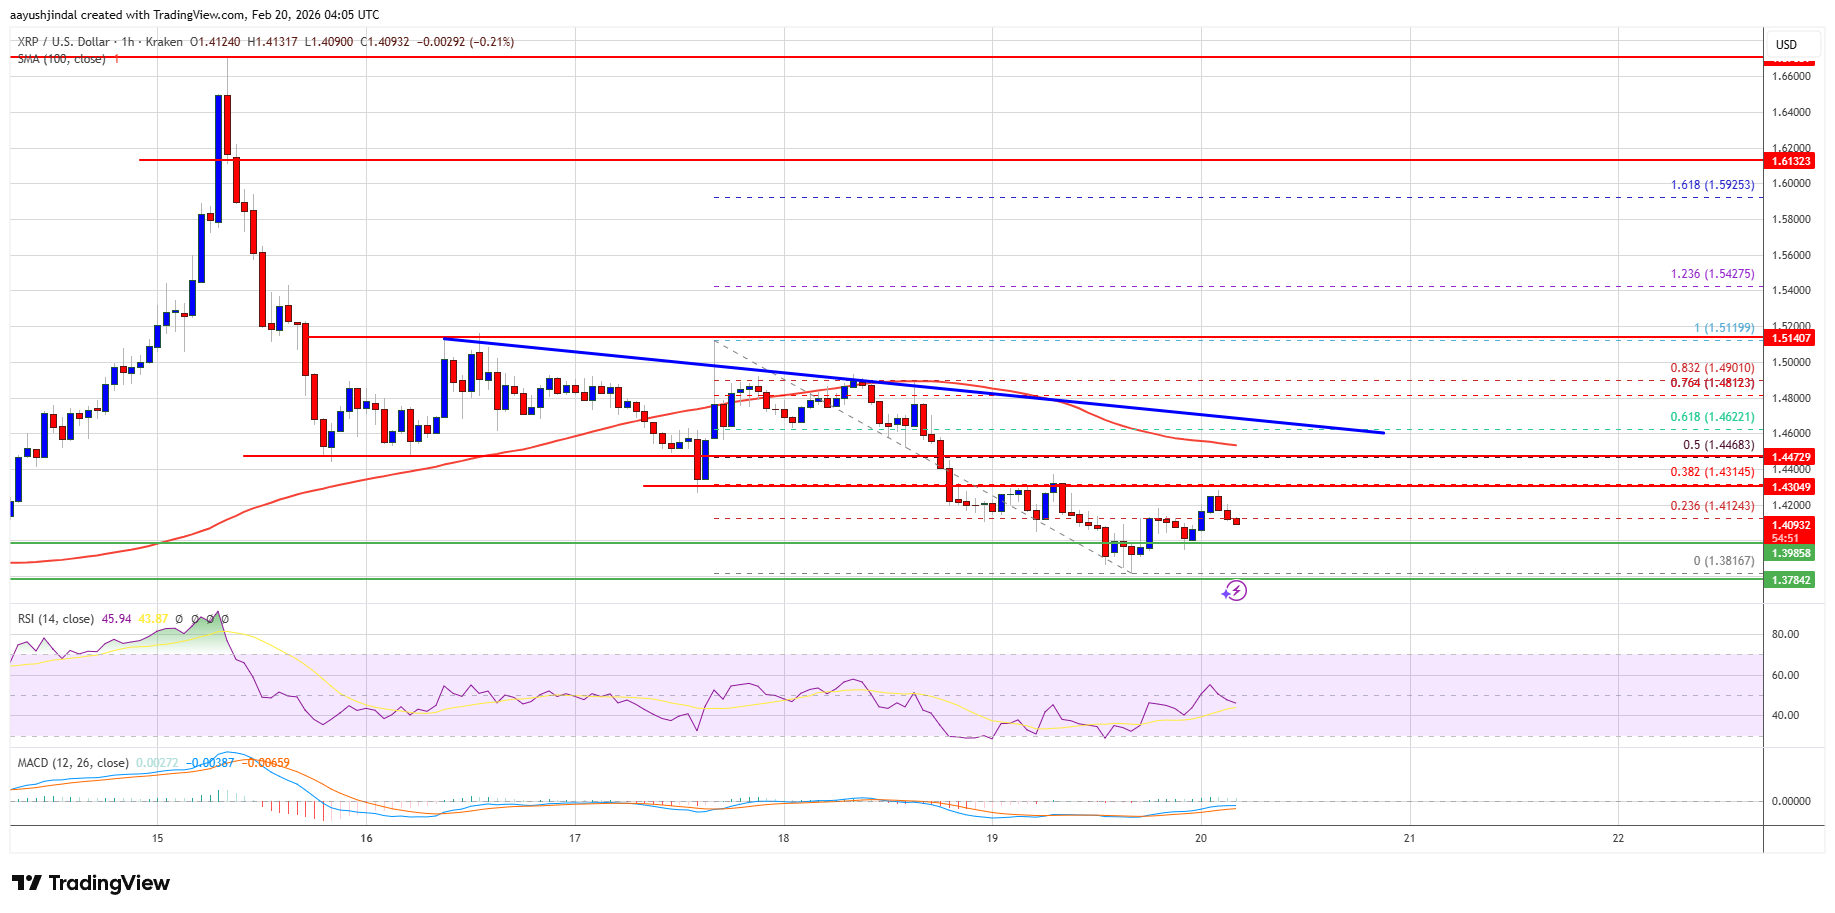
XRP price has declined below $1.420, entering a short-term bearish zone. Key resistances are at $1.450 and $1.4620, while initial support sits around $1.3980. The MACD and RSI indicate bearish momentum.
Predictions Markets
See what traders are focused on

XRP price extended losses and traded below $1.40. The price is now consolidating losses but faces hurdles near $1.4320 and $1.450.
- XRP price started another decline and traded below the $1.420 zone.
- The price is now trading below $1.420 and the 100-hourly Simple Moving Average.
- There is a key bearish trend line forming with resistance at $1.4620 on the hourly chart of the XRP/USD pair (data source from Kraken).
- The pair could continue to move down if it stays below $1.4650.
XRP Price Extends Losses
XRP price failed to stay above $1.450 and extended its decline, like Bitcoin and Ethereum. The price declined below $1.420 and $1.4150 to enter a short-term bearish zone.
The price even extended losses below $1.40. A low was formed at $1.3816, and the price is now consolidating losses. There was a minor upward move above the 23.6% Fib retracement level of the downward move from the $1.5120 swing high to the $1.3816 low.
The price is now trading below $1.420 and the 100-hourly Simple Moving Average. If there is a fresh recovery move, the price might face resistance near the $1.4320 level. The first major resistance is near the $1.450 level or the 50% Fib retracement level of the downward move from the $1.5120 swing high to the $1.3816 low.
The main resistance could be $1.4620. There is also a key bearish trend line forming with resistance at $1.4620 on the hourly chart of the XRP/USD pair. A close above $1.4620 could send the price to $1.480.
The next hurdle sits at $1.50. A clear move above the $1.50 resistance might send the price toward the $1.5320 resistance. Any more gains might send the price toward the $1.550 resistance. The next major hurdle for the bulls might be near $1.5650.
Downside Continuation?
If XRP fails to clear the $1.4620 resistance zone, it could start a fresh decline. Initial support on the downside is near the $1.3980 level. The next major support is near the $1.3850 level.
If there is a downside break and a close below the $1.3850 level, the price might continue to decline toward $1.3620. The next major support sits near the $1.350 zone, below which the price could continue lower toward $1.320.
Technical Indicators
Hourly MACD – The MACD for XRP/USD is now gaining pace in the bearish zone.
Hourly RSI (Relative Strength Index) – The RSI for XRP/USD is now below the 50 level.
Major Support Levels – $1.3850 and $1.3620.
Major Resistance Levels – $1.4500 and $1.4620.


Read More

Analyst Predicts XRP Could Surge To $17, Challenge Ethereum in Next Bull Run