Bitcoin Price Analysis: Here’s How BTC Gets to $100K
Share:
Predictions Markets
See what traders are focused on

The Bitcoin price has been rallying rapidly over recent days, breaking past multiple historical and psychological resistance levels. Many market participants are now expecting BTC to reach $100K soon.
Technical Analysis
By Edris Derakhshi (TradingRage)
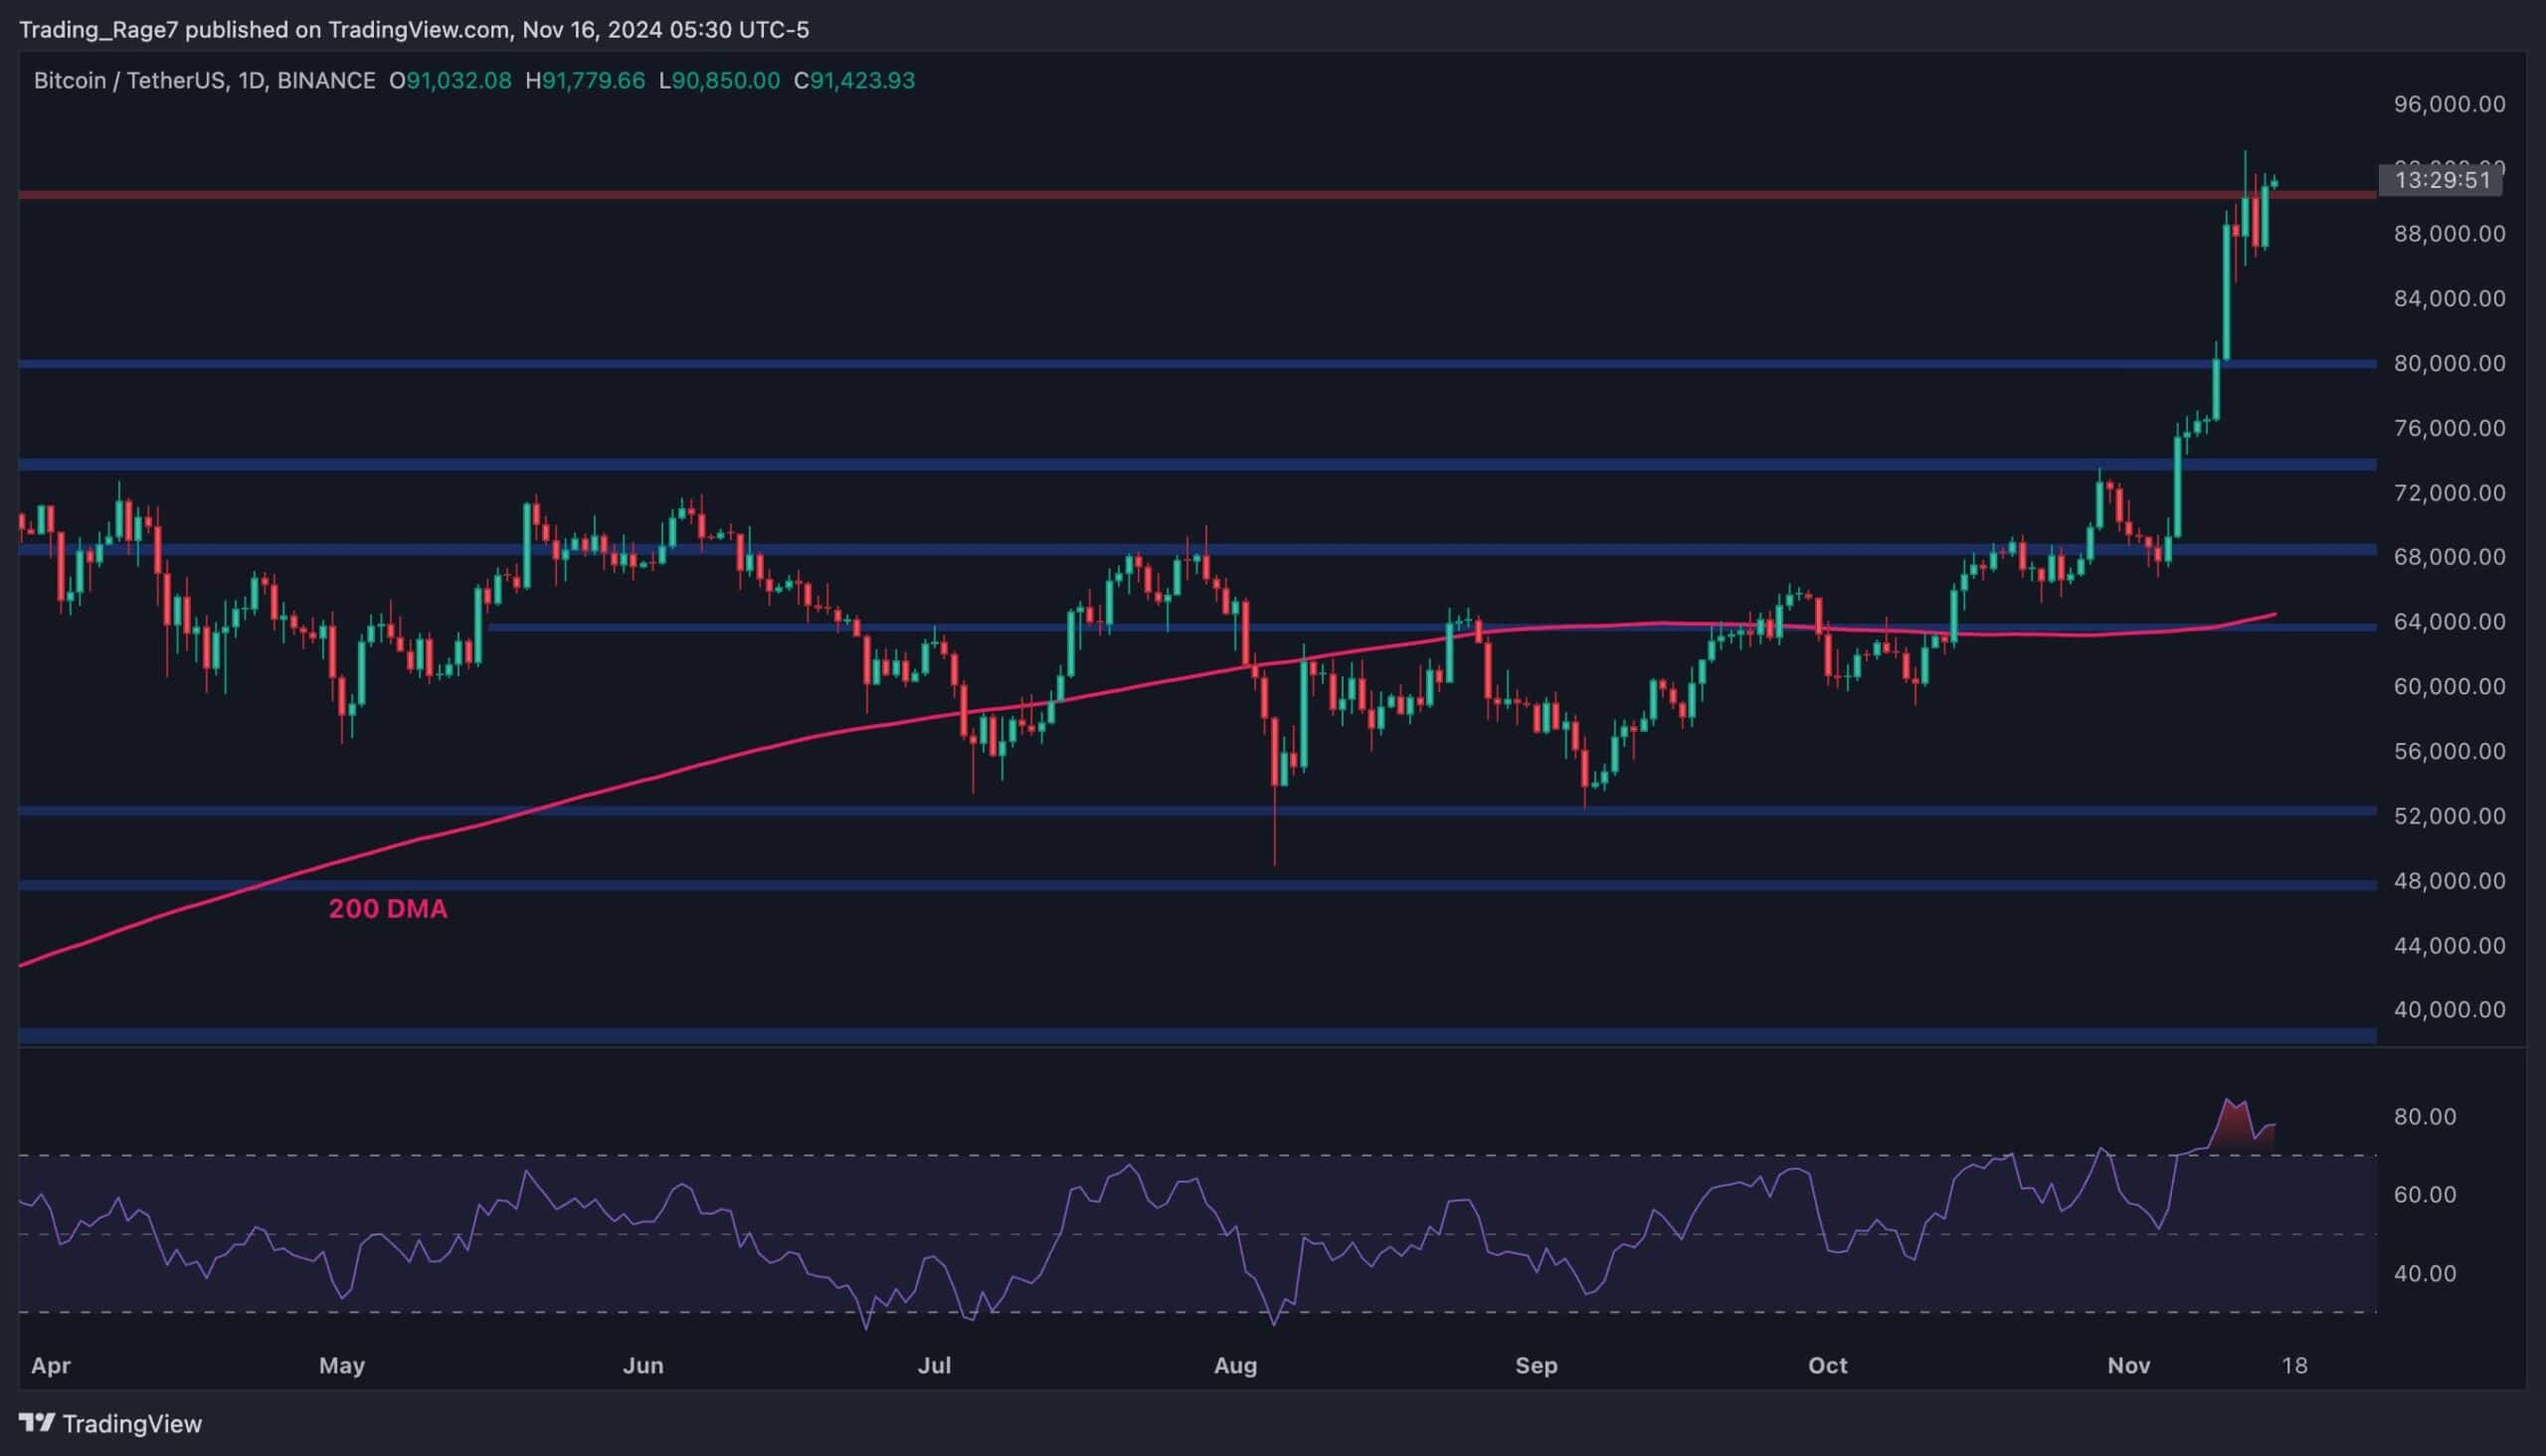
The Daily Chart
On the daily chart, the market has been aggressively surging following a bounce from $70K. The $80K and $85K levels have been broken to the upside, and the market is currently trading around the $90K psychological resistance mark.
Meanwhile, the RSI is showing an overbought signal, which could mean a potential correction or consolidation in the short term.
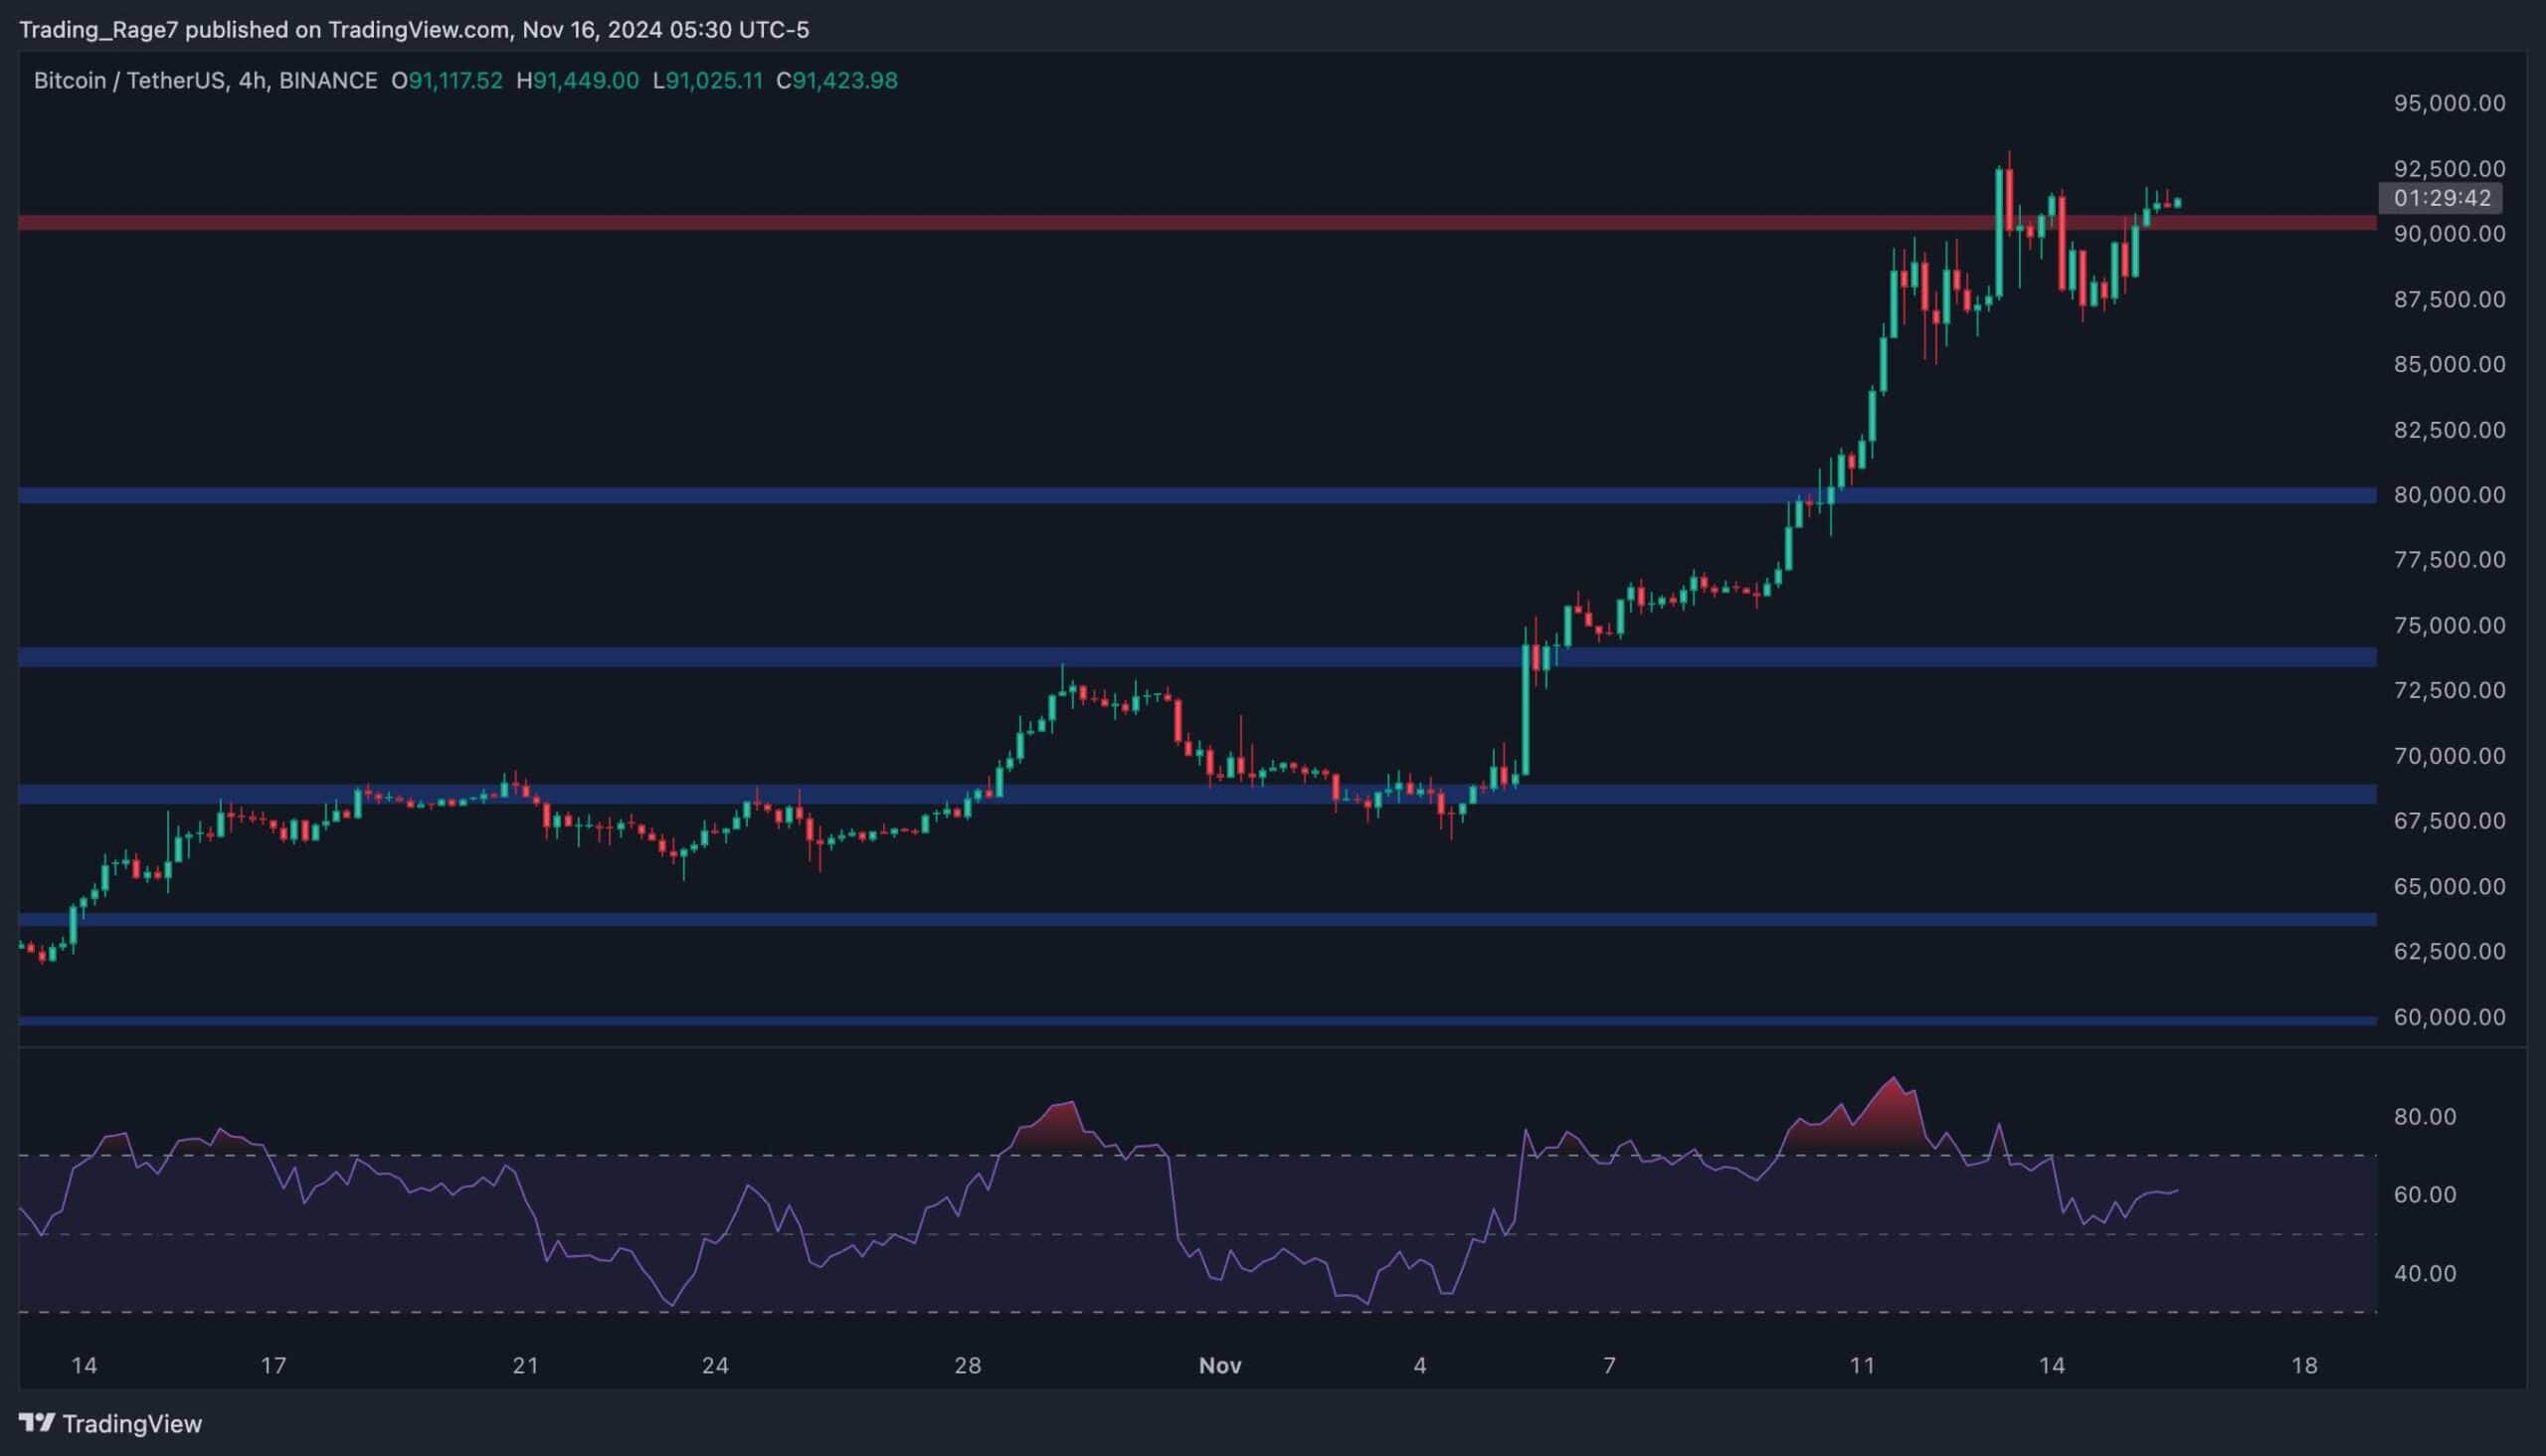
The 4-Hour Chart
Looking at the 4-hour chart, the price has recently been consolidating around the $90K psychological resistance level.
The RSI is also showing a bearish divergence around this area, leading to a potential consolidation or correction. In case of a pullback, a drop toward the $80K area would be probable.
On the other hand, a bullish breakout could pave the way for a rally toward $100K.
On-Chain Analysis
By Edris Derakhshi (TradingRage)
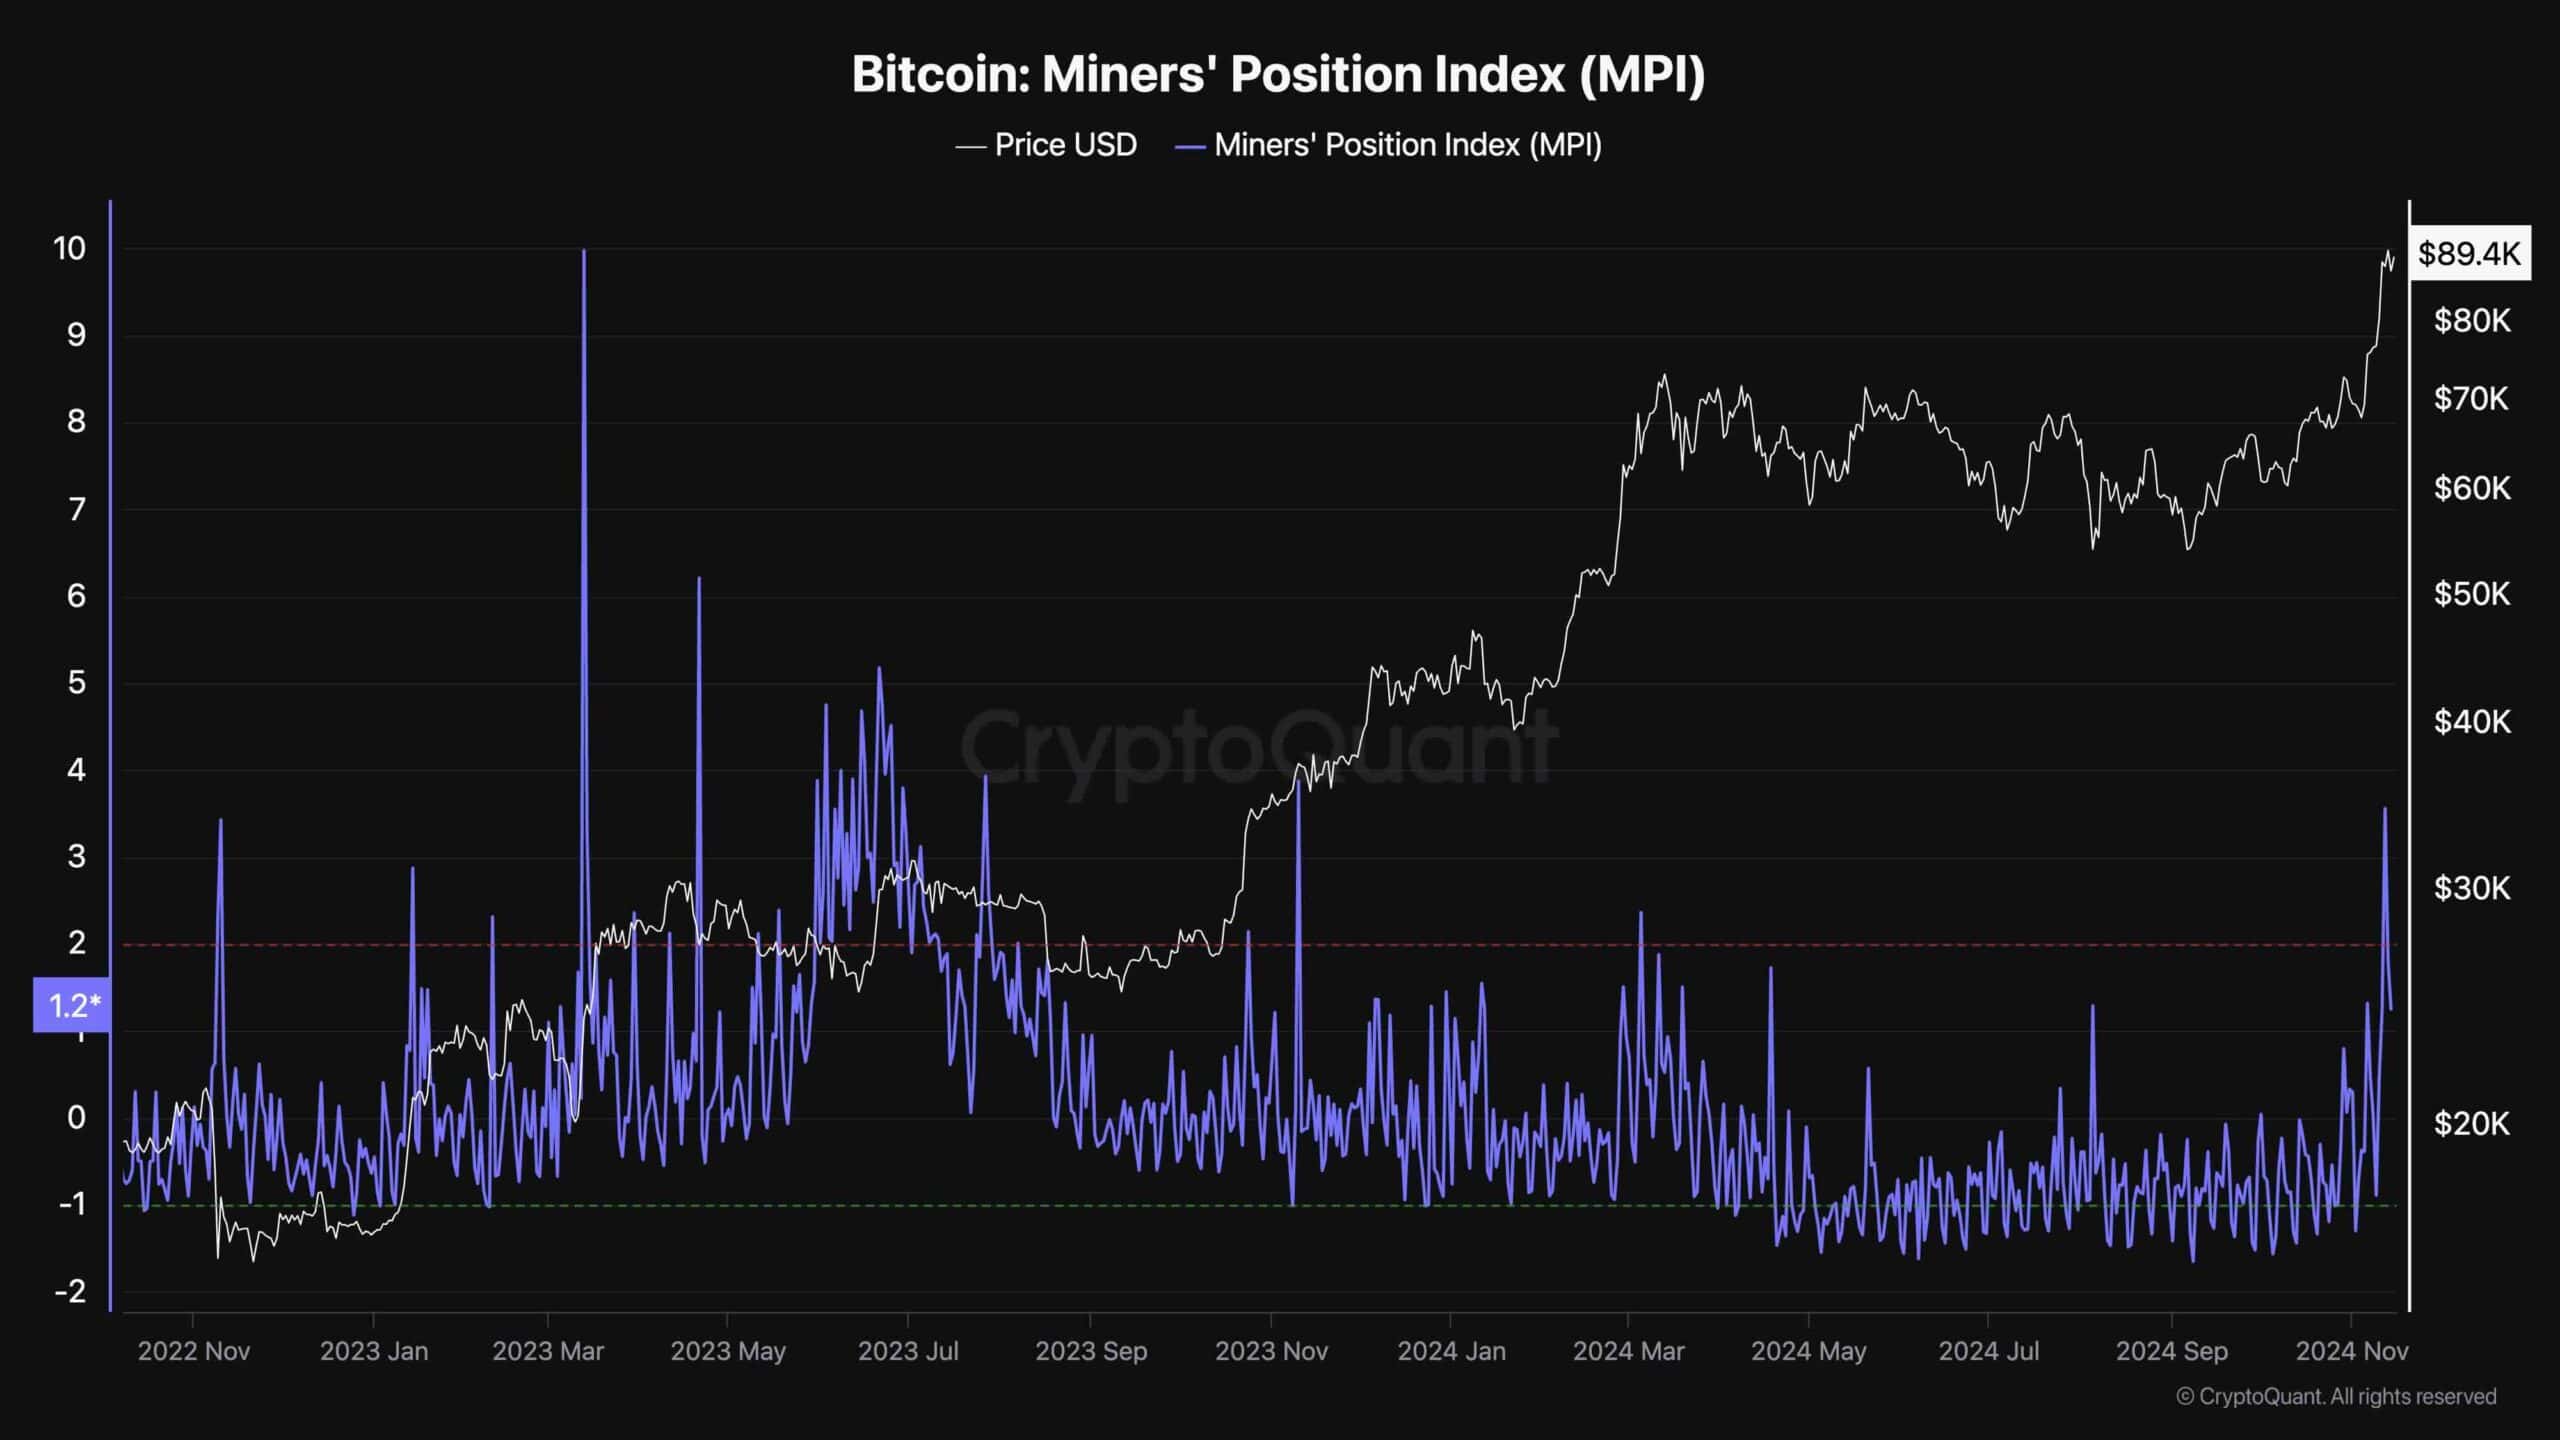
Miners Position Index
As the BTC price has been rallying rapidly over the past few weeks, miners are finally beginning to change their behavior. Analyzing metrics that show miners’ transactions can, therefore, be beneficial in understanding the underlying market dynamics.
This chart presents the Miners Position Index (MPI). The MPI metric is the ratio of total miner outflow to its one-year moving average of total miner outflow. Higher values indicate heavy selling pressure, which could lead to potential price downturns.
As the chart suggests, BTC miners have finally begun to sell their coins more aggressively as the market has created a new all-time high. If this trend continues, the market will likely experience a correction or even a potential crash.
The post Bitcoin Price Analysis: Here’s How BTC Gets to $100K appeared first on CryptoPotato.


Read More

Bitcoin Price Analysis: What’s Next for BTC After 11% Weekly Crash?
