Bitcoin Price Analysis: What’s Next for BTC After 11% Weekly Crash?

Share:
Predictions Markets
See what traders are focused on

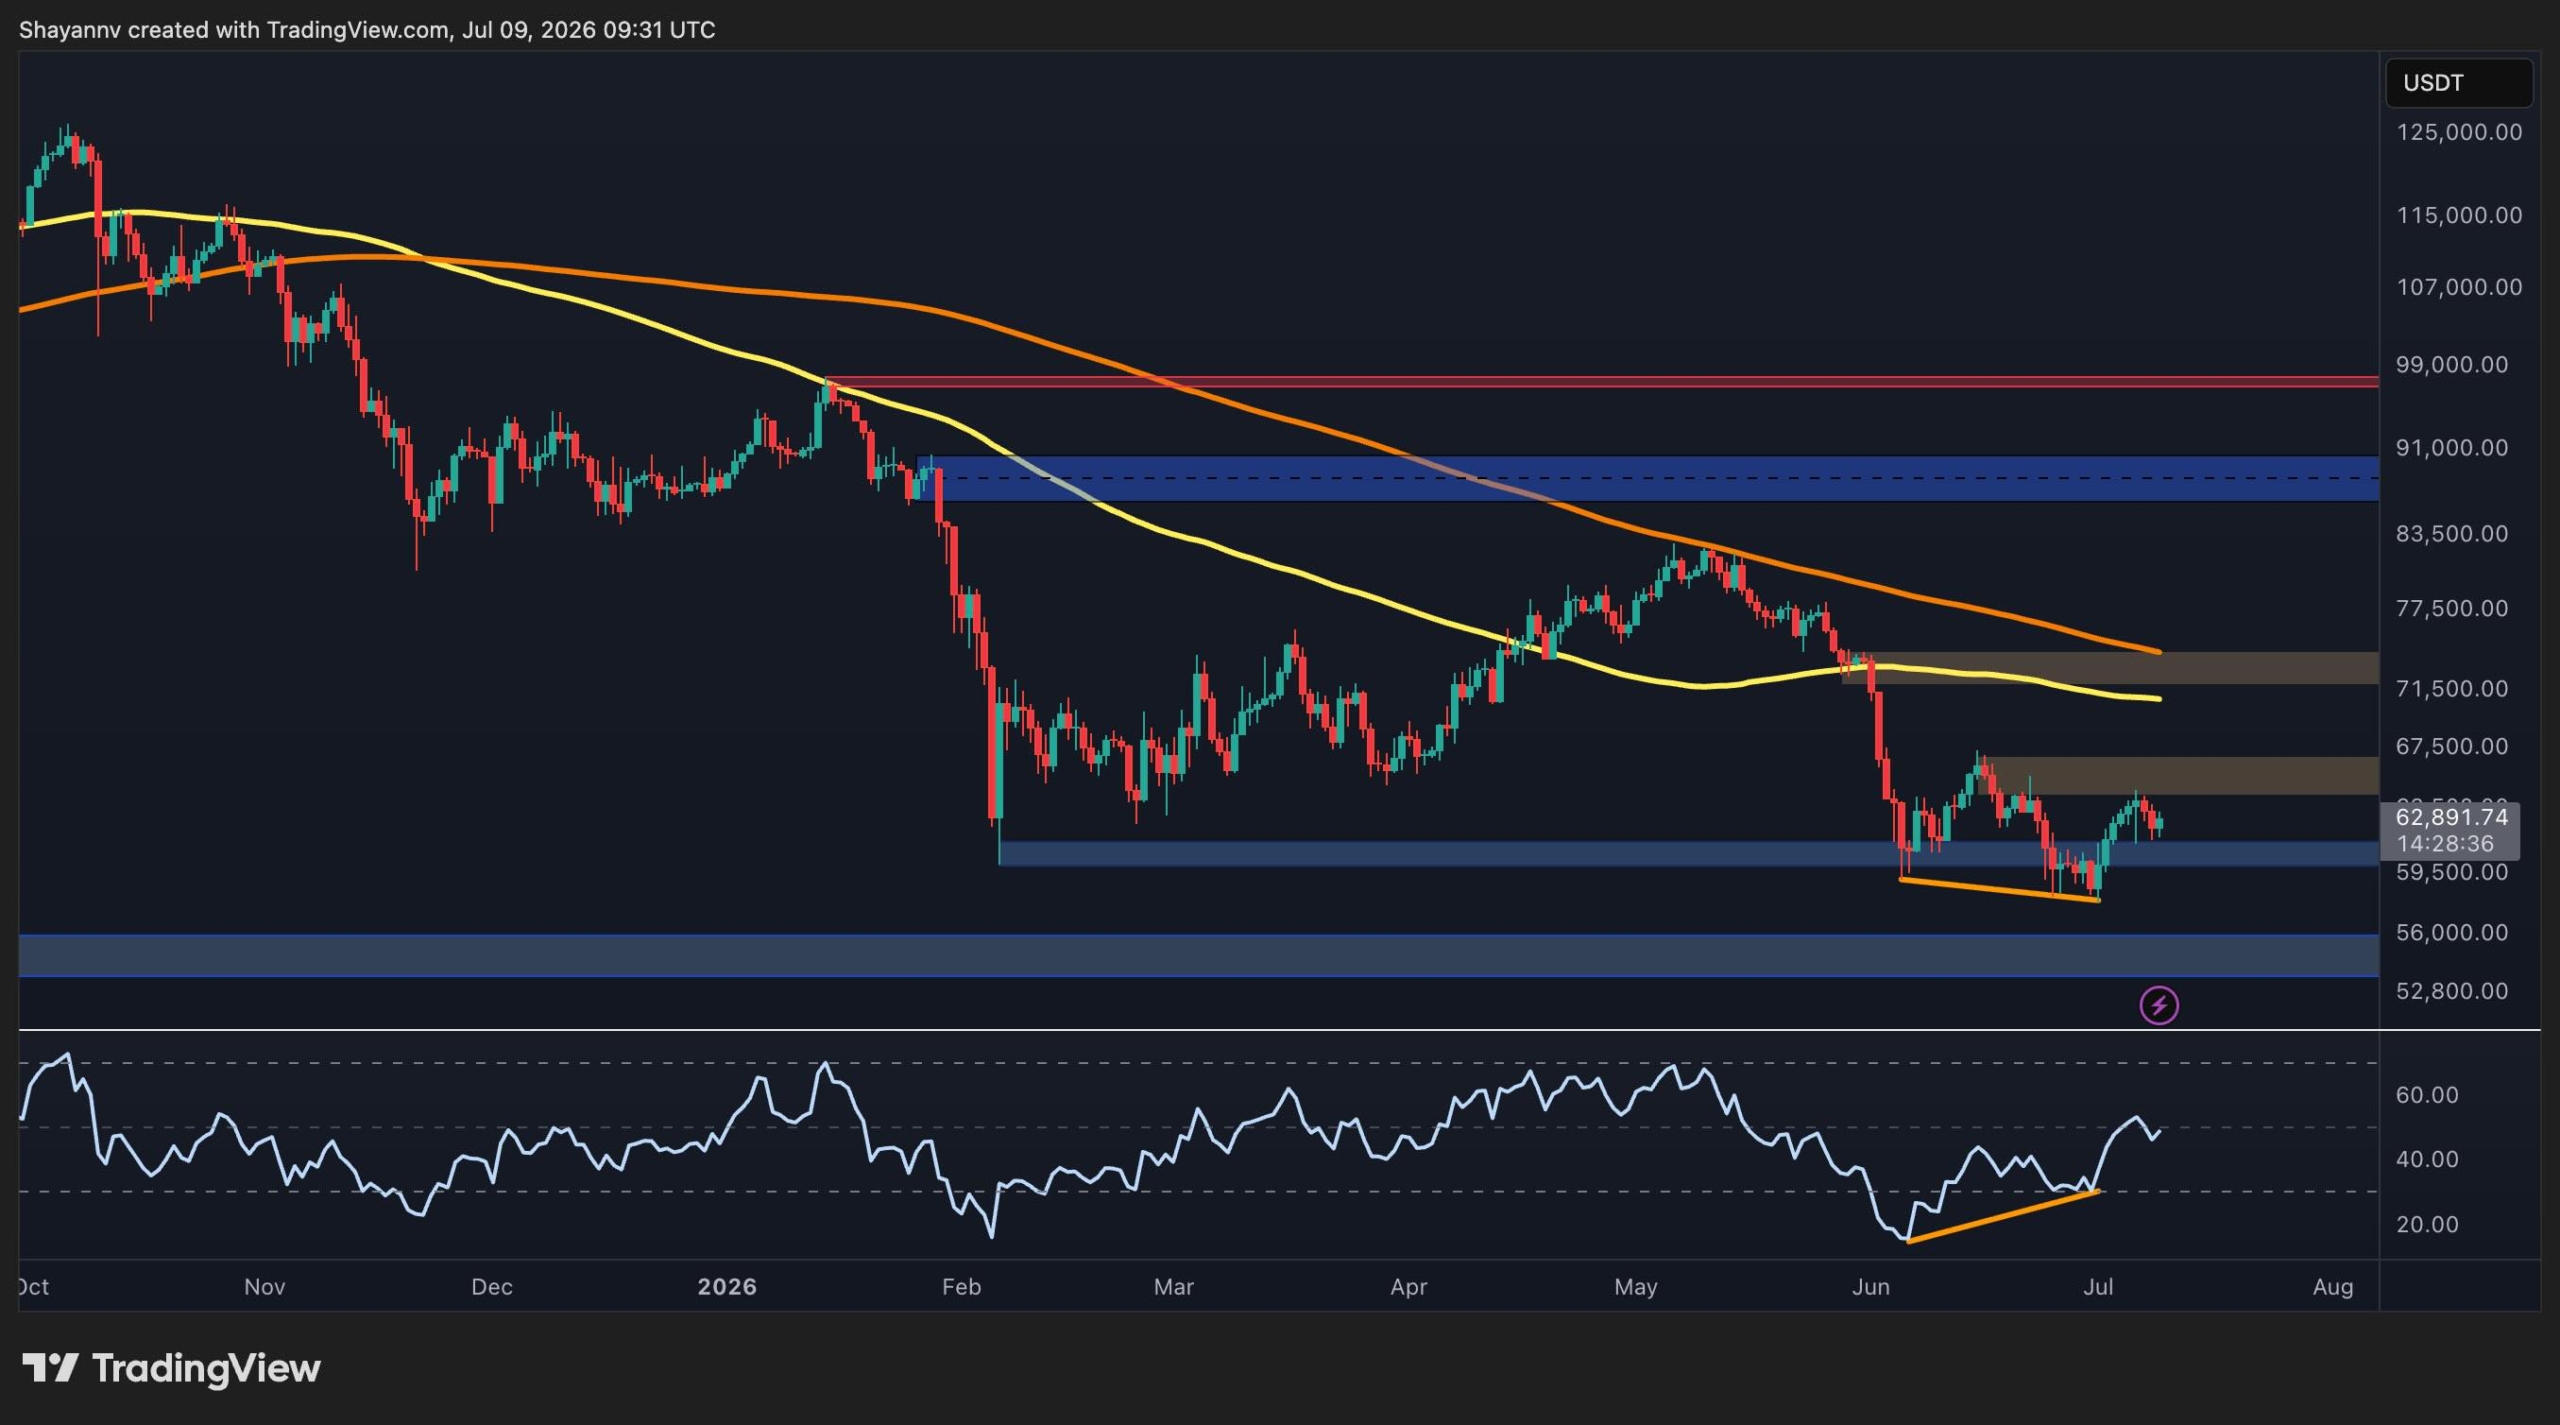
Bitcoin has suffered a decisive breakdown from its multi-month rising channel, triggering a sharp sell-off that pushed the price toward a major support cluster around $65K. The rejection from the 100-day moving average and the inability to reclaim lost support levels suggest sellers remain in control in the near term, although BTC is now approaching an area where demand previously emerged.
Bitcoin Price Analysis: The Daily Chart
On the daily timeframe, Bitcoin has invalidated the ascending channel structure that guided the price action for several months. After failing to hold above the channel’s lower boundary, BTC accelerated lower and lost the 100-day moving average around $73.5K, which had acted as an important dynamic support throughout the recovery phase.
In This News
Coins

$ 64.13K
+0.04%
$ 0.00186
Predictions Markets
See what traders are focused on
Share:
In This News
Coins
$ 64.13K
+0.04%$ 0.00186
Predictions Markets
See what traders are focused on
Share:
Read More

BTC’s Hidden Liquidity Cluster That Will Decide the Next Move: Bitcoin Price Analysis