Bulls in Action: Will Solana (SOL) Conquer Its Nearest Key Resistance Levels Soon?
Share:

- Solana is hovering around the $142 mark.
- SOL’s trading volume has surged by over 18%.
The broader crypto market’s 3.03% uptick within the extreme fear sentiment has pushed the major assets to fluctuate between losses and gains. They are attempting to escape the bearish wave. Notably, the largest assets like Bitcoin (BTC) and Ethereum (ETH) are hovering at $91K and $3K, respectively. Meanwhile, Solana (SOL) has posted a 3.09% gain.
In the early hours, the altcoin traded at its bottom range of $135.63. Later, with a brief bullish shift in the SOL market, the price hit a daily high of $144.47, breaking the resistance between $136 and $143 levels. Upon the bulls gaining more traction, the asset could see additional gains. At the time of writing, Solana traded within the $142.55 zone.
Besides, with the asset’s market cap at $80.14 billion, the daily trading volume of SOL has increased by over 18.59%, reaching the $5.39 billion mark. Furthermore, the market has experienced $16.14 million worth of Solana liquidations in the last 24 hours, as reported by the Coinglass data.
Will Solana’s Current Momentum Push It Into a Strong Bullish Phase?
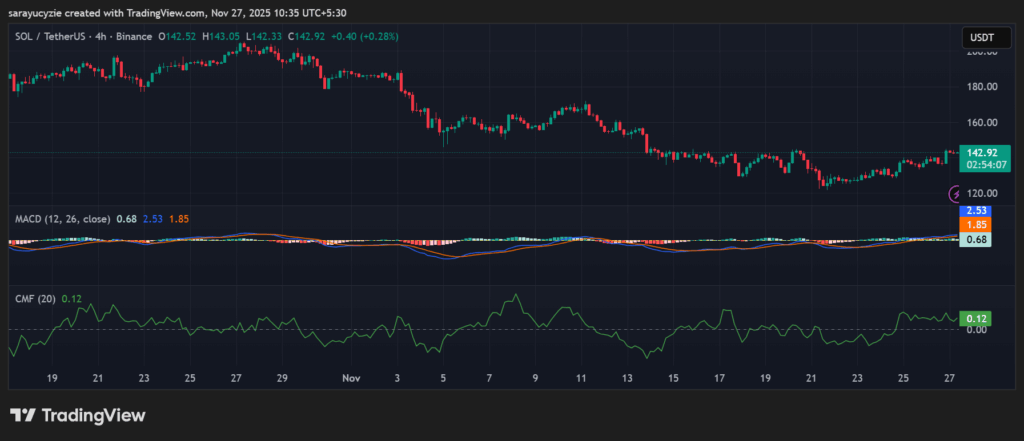
The recent price chart of Solana reflects the positive outlook, with the green candle lit up. If the price could climb above the $145.32 resistance level, the potent bulls might trigger the emergence of the death cross. Gradually, the asset’s price would move up to its recent high at around $148.67.
On the downside, with the asset exhibiting a bearish reversal, the SOL price might fall steadily toward the nearest support at the $139.48 range. In the case of a strong correction, the death cross takes place, and the altcoin could take the price to a low of $136.85, which may push for more losses.
SOL’s Moving Average Convergence Divergence line is settled above the signal line. It implies that the bullish momentum is strengthening, as the faster-moving MACD line is rising quickly than the signal line. The upward price movement may continue, showing the improving market sentiment.

In addition, the asset’s Chaikin Money Flow (CMF) value, positioned at 0.12, points out the positive buying pressure in the SOL market. Also, the money is flowing into the asset, hinting at a moderate accumulation. The buyers currently have the upper hand, supporting the ongoing momentum.
The daily Relative Strength Index (RSI) of Solana at 62.65 indicates its bullish zone. This level likely shows healthy upward strength, with enough room for further gains to reach the overbought territory. Moreover, SOL’s Bull Bear Power (BBP) reading found at 6.59 suggests strong bullish dominance. The price is trading above, backing the possibility of continued upward movement if momentum holds.
Top Updated Crypto News
Bitcoin Cash Leads Gains as Crypto Investors Eye Market Rebound
Bulls in Action: Will Solana (SOL) Conquer Its Nearest Key Resistance Levels Soon?
Share:

- Solana is hovering around the $142 mark.
- SOL’s trading volume has surged by over 18%.
The broader crypto market’s 3.03% uptick within the extreme fear sentiment has pushed the major assets to fluctuate between losses and gains. They are attempting to escape the bearish wave. Notably, the largest assets like Bitcoin (BTC) and Ethereum (ETH) are hovering at $91K and $3K, respectively. Meanwhile, Solana (SOL) has posted a 3.09% gain.
In the early hours, the altcoin traded at its bottom range of $135.63. Later, with a brief bullish shift in the SOL market, the price hit a daily high of $144.47, breaking the resistance between $136 and $143 levels. Upon the bulls gaining more traction, the asset could see additional gains. At the time of writing, Solana traded within the $142.55 zone.
Besides, with the asset’s market cap at $80.14 billion, the daily trading volume of SOL has increased by over 18.59%, reaching the $5.39 billion mark. Furthermore, the market has experienced $16.14 million worth of Solana liquidations in the last 24 hours, as reported by the Coinglass data.
Will Solana’s Current Momentum Push It Into a Strong Bullish Phase?
The recent price chart of Solana reflects the positive outlook, with the green candle lit up. If the price could climb above the $145.32 resistance level, the potent bulls might trigger the emergence of the death cross. Gradually, the asset’s price would move up to its recent high at around $148.67.
On the downside, with the asset exhibiting a bearish reversal, the SOL price might fall steadily toward the nearest support at the $139.48 range. In the case of a strong correction, the death cross takes place, and the altcoin could take the price to a low of $136.85, which may push for more losses.
SOL’s Moving Average Convergence Divergence line is settled above the signal line. It implies that the bullish momentum is strengthening, as the faster-moving MACD line is rising quickly than the signal line. The upward price movement may continue, showing the improving market sentiment.

In addition, the asset’s Chaikin Money Flow (CMF) value, positioned at 0.12, points out the positive buying pressure in the SOL market. Also, the money is flowing into the asset, hinting at a moderate accumulation. The buyers currently have the upper hand, supporting the ongoing momentum.
The daily Relative Strength Index (RSI) of Solana at 62.65 indicates its bullish zone. This level likely shows healthy upward strength, with enough room for further gains to reach the overbought territory. Moreover, SOL’s Bull Bear Power (BBP) reading found at 6.59 suggests strong bullish dominance. The price is trading above, backing the possibility of continued upward movement if momentum holds.
Top Updated Crypto News
Bitcoin Cash Leads Gains as Crypto Investors Eye Market Rebound


