Bitcoin Fisher Transform Reaches Critical Level Not Seen Since 2021, What This Means

Share:
Predictions Markets
See what traders are focused on

The Bitcoin price has had a rocky start to the new week after losing its footing above $52,000 on Tuesday. However, all hope is not lost, as indicators still point to a continuation of this trend. Crypto analyst Tony The Bull has identified an important trend in the Bitcoin chart which could trigger a continuation of the trend back above $52,000.
Bitcoin 1-Week Fisher Transform At Crucial Point
In an analysis posted on X (formerly Twitter), the crypto analyst shared a chart that showed the Bitcoin Fisher Transform in comparison to price. Most importantly, the chart showed the 1-week Fisher Transform and how it has moved since 2017.
The analysis shows some similarities between the current trend and the trends seen in 2017. A similar trend was also seen in 2019 and 2021, where the Fisher Transform rose rapidly before falling. But the importance of this trend lies in where the Fisher Transform heads next from here.
The current important level is the 1.5 Standard Deviation, which has been a crucial point whenever this trend has occurred. Now, if the Fisher Transform is able to stay above this level, it is bullish for the price. However if it falls below this standard deviation, it is very bearish for the price.
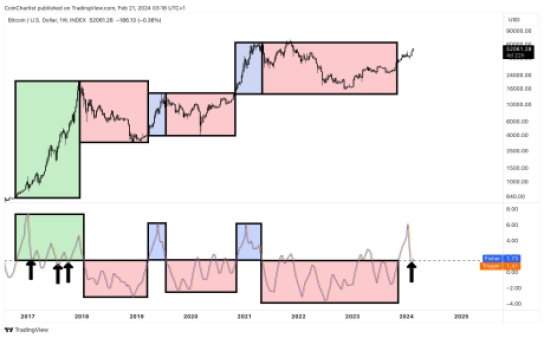
“This is a pivotal area based on historical price action and its exhibiting 2017-like behavior not seen in 2019 or 2021,” the crypto analyst explains. “Below it tends to incite bearish trends, while holding above gives bulls extra vigor.”
Bears And Bulls Vie For Control Over BTC Price
The interest in the next direction of the Bitcoin price has seen bulls and bears lock horns over which camp will reclaim control of BTC. This has seen the price of the digital asset fluctuate wildly over the last few days, going from $53,000 to below $51,000, before bouncing back up once again in the early hours of Wednesday.
This tug-of-war continues to hold the price of Bitcoin down, but investor sentiment seems to be climbing even through this. According to the Bitcoin Fear & Greed Index, investor sentiment has reached Extreme Greed for the first time in one year.
Historically, the index going into extreme greed has signaled the top of the market, with prices trending downward not too long after. However, Bitcoin is still seeing positive indicators, with its trading volume rising more than 40% in the last 24 hours alone.


Read More

Adam Back and Michael Saylor Oppose BIP 110, Warn Bitcoin Fork Could Split Network