Daily Analysis: BTC, ETH, BNT, LINK, MKR

Share:
Predictions Markets
See what traders are focused on


Markets are riding on bear activity today, with the global market cap sitting 1.42% below its previous 24-hour mark, as the total cap still stands at $1.06T as of press time. The fear and greed index has dropped back to 42 as fear gets back into the markets.
Bitcoin price analysis
Bitcoin (BTC) has started on bear activity today, as Bitcoin price stood at $26.8K as of press time after recording a daily decrease of 0.82% and a weekly drop of 2.74%. As a result of the Bitcoin price, the token’s trade volume rose by 7% during the same period and is presently at $12.3B.
The Bollinger bands are now slightly diverging, showing rising volatility levels on Bitcoin Price as the Relative Strength Index (RSI) moves below the average line, showing bear effect on Bitcoin price.

Ethereum price analysis
Ethereum (ETH) is riding on bull activity, as Ethereum price stood at $1565 after recording a daily increase of 0.65%, as the weekly drop now stands at 4.44%. ETH’s trade volume dropped by 13% during the same period and is presently at $4.8B.
The Bollinger bands are diverging, showing increasing volatility levels on Ethereum Price. The Relative Strength Index (RSI) is moving below the average line, showing bear effects on Ethereum price.

Bancor price analysis
Bancor (BNT) is also riding on bull activity, as Bancor price stood at $0.5164 after recording a daily increase of 3.25%, as the weekly rise now stands at 30.4%. BNT’s trade volume Jumped by 164% during the same period and is presently at $91.1M.
The Bollinger bands have wholly diverged, showing high volatility levels on Bancor Price. The Relative Strength Index (RSI) is moving above the average line, showing bull effects on Bancor price.

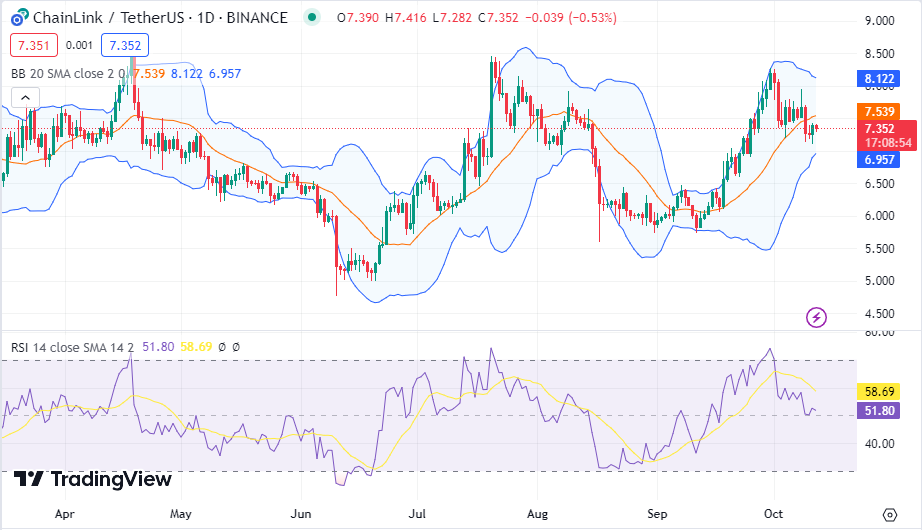
Chainlink price analysis
Chainlink (LINK) is also riding on bull activity, as Chainlink price stood at $7.36 after recording a daily increase of 2.13%, as the weekly drop now stands at 4.4%. LINK’s trade volume Jumped by 4% during the same period and is presently at $193.9M.
The Bollinger bands are converging, showing low volatility levels on Chainlink Price. The Relative Strength Index (RSI) is moving below the average line, showing bear effects on Chainlink price.
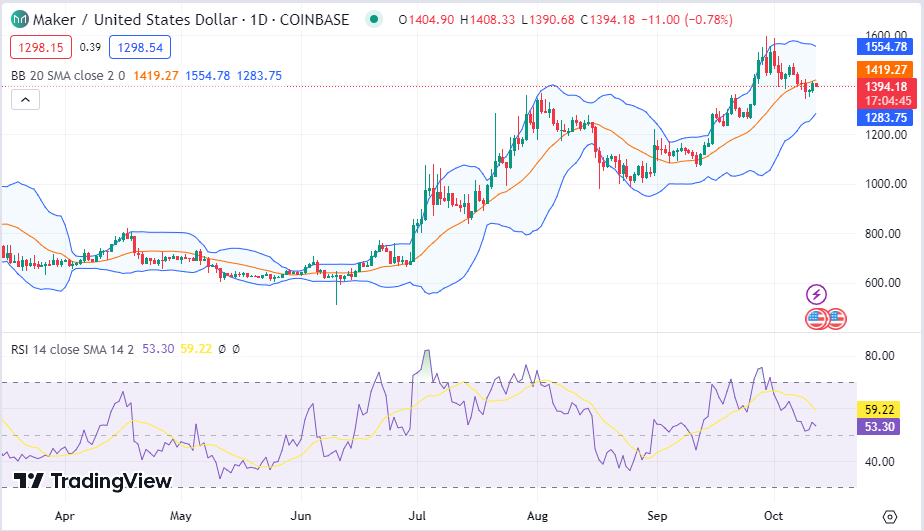
Maker price analysis
Maker (MKR) is also riding on bull activity, as Maker price stood at $01397.31 after recording a daily increase of 1.54%, as the weekly drop now stands at 3.29%. MKR’s trade volume dropped by 9% during the same period and is presently at $37.17M.
The Bollinger bands are converging, showing dropping volatility levels on Maker Price. The Relative Strength Index (RSI) is moving below the average line as bulls push for a crossover above the line with bearishness wearing off from Maker price.
In This News
Coins

$ 64.26K
+2.70%
$ 1.79K
+3.09%
$ 1.35K
+2.22%
$ 7.95
+3.15%
$ 0.267
+0.45%


Predictions Markets
See what traders are focused on
Share:
In This News
Coins
$ 64.26K
+2.70%$ 1.79K
+3.09%$ 1.35K
+2.22%$ 7.95
+3.15%$ 0.267
+0.45%Predictions Markets
See what traders are focused on
Share:
Read More
Bitcoin, XRP, DOGE Rise as US-Iran Technical Talks to Continue Despite Strikes