Bitcoin Signal That Has Held Since December Says It’s Time To Sell

Share:
Predictions Markets
See what traders are focused on

An analyst has explained that an indicator that has been holding for Bitcoin since December is now giving a sell signal for the cryptocurrency.
TD Sequential Is Providing A Sell Signal On Daily Bitcoin Chart Currently
In a new post on X, analyst Ali discussed a TD Sequential sell signal forming in the Bitcoin daily price chart. The “Tom Demark (TD) Sequential” is an indicator in technical analysis used for pinpointing locations of probable tops and bottoms in any asset’s price.
The TD Sequential has two phases. The first is called the “setup” and lasts nine candles. Once nine candles (of the same polarity) are in, the setup completes, and the indicator signals a likely reversal for the price.
The direction of such a reversal naturally depends on the type of candles that formed the setup. If these candles were green, the indicator would imply a top for the asset, while red candles would suggest a bottom.
When the setup finishes, the “countdown” phase begins. In this phase, candles of the same type are counted again, except for thirteen. Once the countdown also completes, another potential reversal could be assumed to have occurred for the price.
Recently, Bitcoin has finished a TD Sequential phase of the former type. Here is the chart shared by the analyst that shows this pattern forming in the daily price of the cryptocurrency:
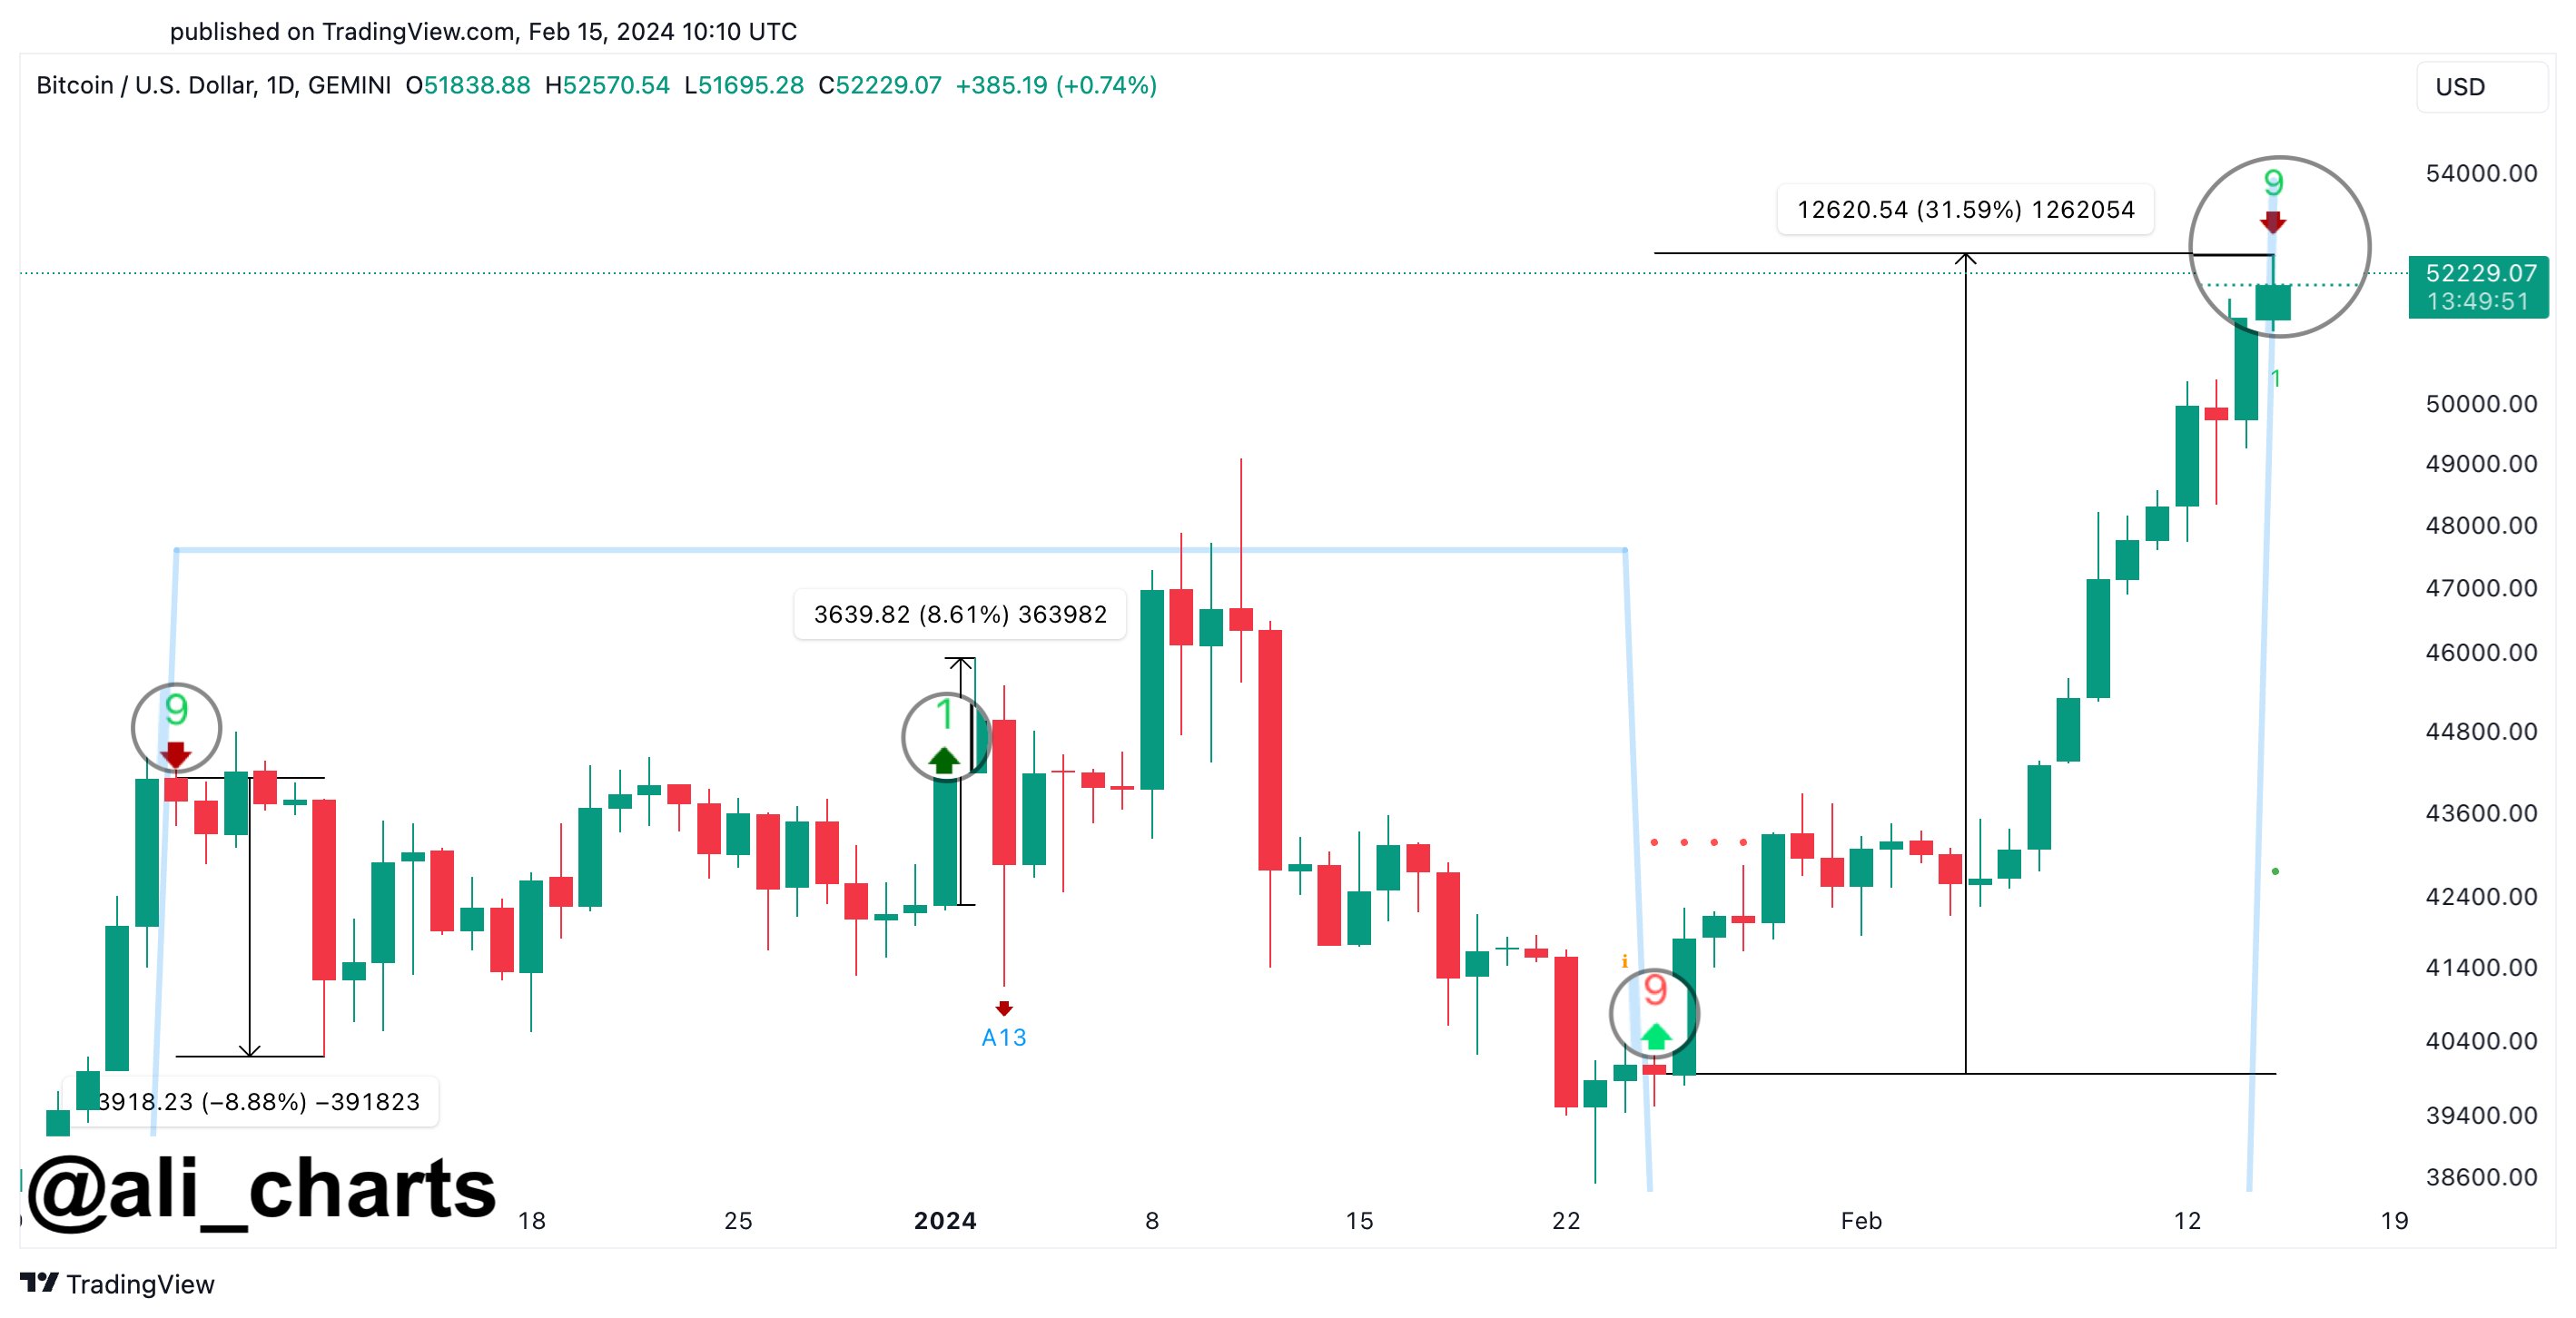
As is visible in the graph, the TD Sequential setup has recently finished with green candles for Bitcoin. These green candles have come for the coin as it has enjoyed some sharp bullish momentum, which has taken its price beyond the $52,000 mark.
The fact that the TD Sequential setup has formed with green candles suggests the indicator may now be providing a sell signal for the cryptocurrency’s price.
In the same chart, Ali highlighted the previous instances since December of last year where a setup was completed for the asset. It would appear that both TD Sequential buy and sell signals have held for the coin in this window.
Going by this pattern, the latest TD Sequential reversal signal might also hold for the asset. And as it’s a bearish one this time, the analyst expects a correction lasting for one to four daily candlesticks.
BTC Price
Bitcoin’s recent momentum has meant that the asset has been among the best performers in the sector, registering growth of around 16% during the past week.
Currently, the coin is hovering around the $52,500 level. The chart below shows the asset’s trajectory over the last month.


Read More

U.S.-Japan Intervention Revives Yen Carry Trade Fears—But Dollar Strength Looms as the True Bitcoin Risk