Solana (SOL) Recovery Momentum Hinges on Price Closing Firmly Above $140

Share:
Predictions Markets
See what traders are focused on

Solana started a recovery wave above the $132 zone. SOL price is now consolidating and faces hurdles near the $138 zone.
- SOL price started a decent recovery wave above $130 and $132 against the US Dollar.
- The price is now trading below $138 and the 100-hourly simple moving average.
- There was a break above a key bearish trend line with resistance at $132 on the hourly chart of the SOL/USD pair (data source from Kraken).
- The price could continue to move up if it clears $138 and $140.
Solana Price Eyes Upside Break
Solana price remained stable and started a decent recovery wave from $128, like Bitcoin and Ethereum. SOL was able to climb above the $130 level.
There was a move above the 23.6% Fib retracement level of the downward move from the $147 swing high to the $128 low. Besides, there was a break above a key bearish trend line with resistance at $132 on the hourly chart of the SOL/USD pair.
Solana is now trading below $138 and the 100-hourly simple moving average. On the upside, immediate resistance is near the $137 level, the 100-hourly simple moving average, and the 50% Fib retracement level of the downward move from the $147 swing high to the $128 low.
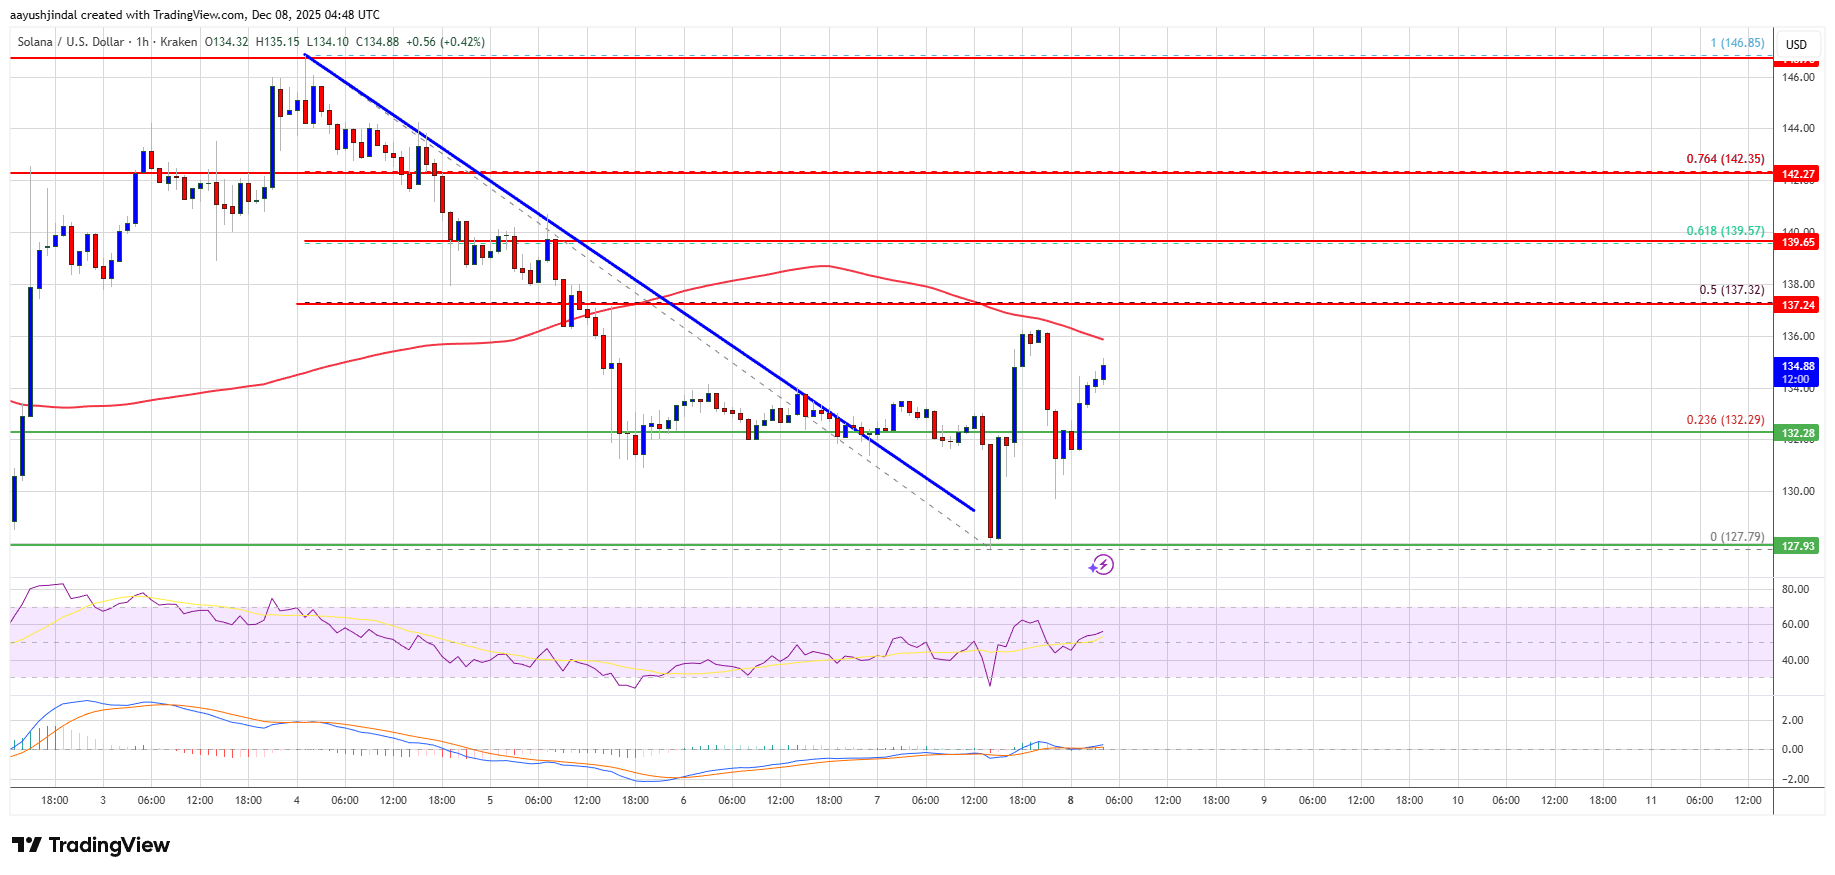
The next major resistance is near the $140 level. The main resistance could be $142. A successful close above the $142 resistance zone could set the pace for another steady increase. The next key resistance is $150. Any more gains might send the price toward the $155 level.
Another Decline In SOL?
If SOL fails to rise above the $140 resistance, it could continue to move down. Initial support on the downside is near the $132 zone. The first major support is near the $130 level.
A break below the $130 level might send the price toward the $128 support zone. If there is a close below the $128 support, the price could decline toward the $120 zone in the near term.
Technical Indicators
Hourly MACD – The MACD for SOL/USD is gaining pace in the bullish zone.
Hourly Hours RSI (Relative Strength Index) – The RSI for SOL/USD is above the 50 level.
Major Support Levels – $132 and $130.
Major Resistance Levels – $138 and $140.


Read More
Solana (SOL) Hits a Key Decision Zone: Can Buyers Reverse the 5% Slide?