
XRP Price Rejection Sparks Drop, Bulls Lose Short-Term Control

Share:
XRP extended losses on Kraken, trading below $1.415–$1.420 and the 100-hour SMA with an intraday low of $1.3835; current consolidation after the break of an hourly bullish trend line. Bearish technicals: MACD gaining downside momentum and RSI below 50; immediate resistances at $1.4150 and $1.4250, major resistance $1.4450; supports at $1.3920 and $1.3840 — a close below $1.3840 could target $1.3650 then $1.350/$1.3220. Outlook: Failure to clear $1.4150 likely means further downside for this crypto token; a decisive close above $1.4250/$1.4450 would be needed to resume upside, important for traders monitoring token performance, risk management and technical signals.
Predictions Markets
See what traders are focused on

XRP price extended losses and traded below $1.420. The price is now consolidating losses and faces hurdles near $1.4120 and $1.4150.
- XRP price started another decline and traded below the $1.4250 zone.
- The price is now trading below $1.4150 and the 100-hourly Simple Moving Average.
- There was a break below a bullish trend line with support at $1.430 on the hourly chart of the XRP/USD pair (data source from Kraken).
- The pair could continue to move down if it stays below $1.4150.
XRP Price Dips Again
XRP price failed to stay above $1.440 and extended its decline, like Bitcoin and Ethereum. The price declined below $1.4320 and $1.430 to enter a short-term bearish zone.
There was a break below a bullish trend line with support at $1.430 on the hourly chart of the XRP/USD pair. The price even extended losses below $1.40. A low was formed at $1.3835, and the price is now consolidating losses. There was a minor recovery wave toward the 23.6% Fib retracement level of the downward move from the $1.4471 swing high to the $1.3835 low.
The price is now trading below $1.4120 and the 100-hourly Simple Moving Average. If there is a fresh recovery move, the price might face resistance near the $1.4010 level.
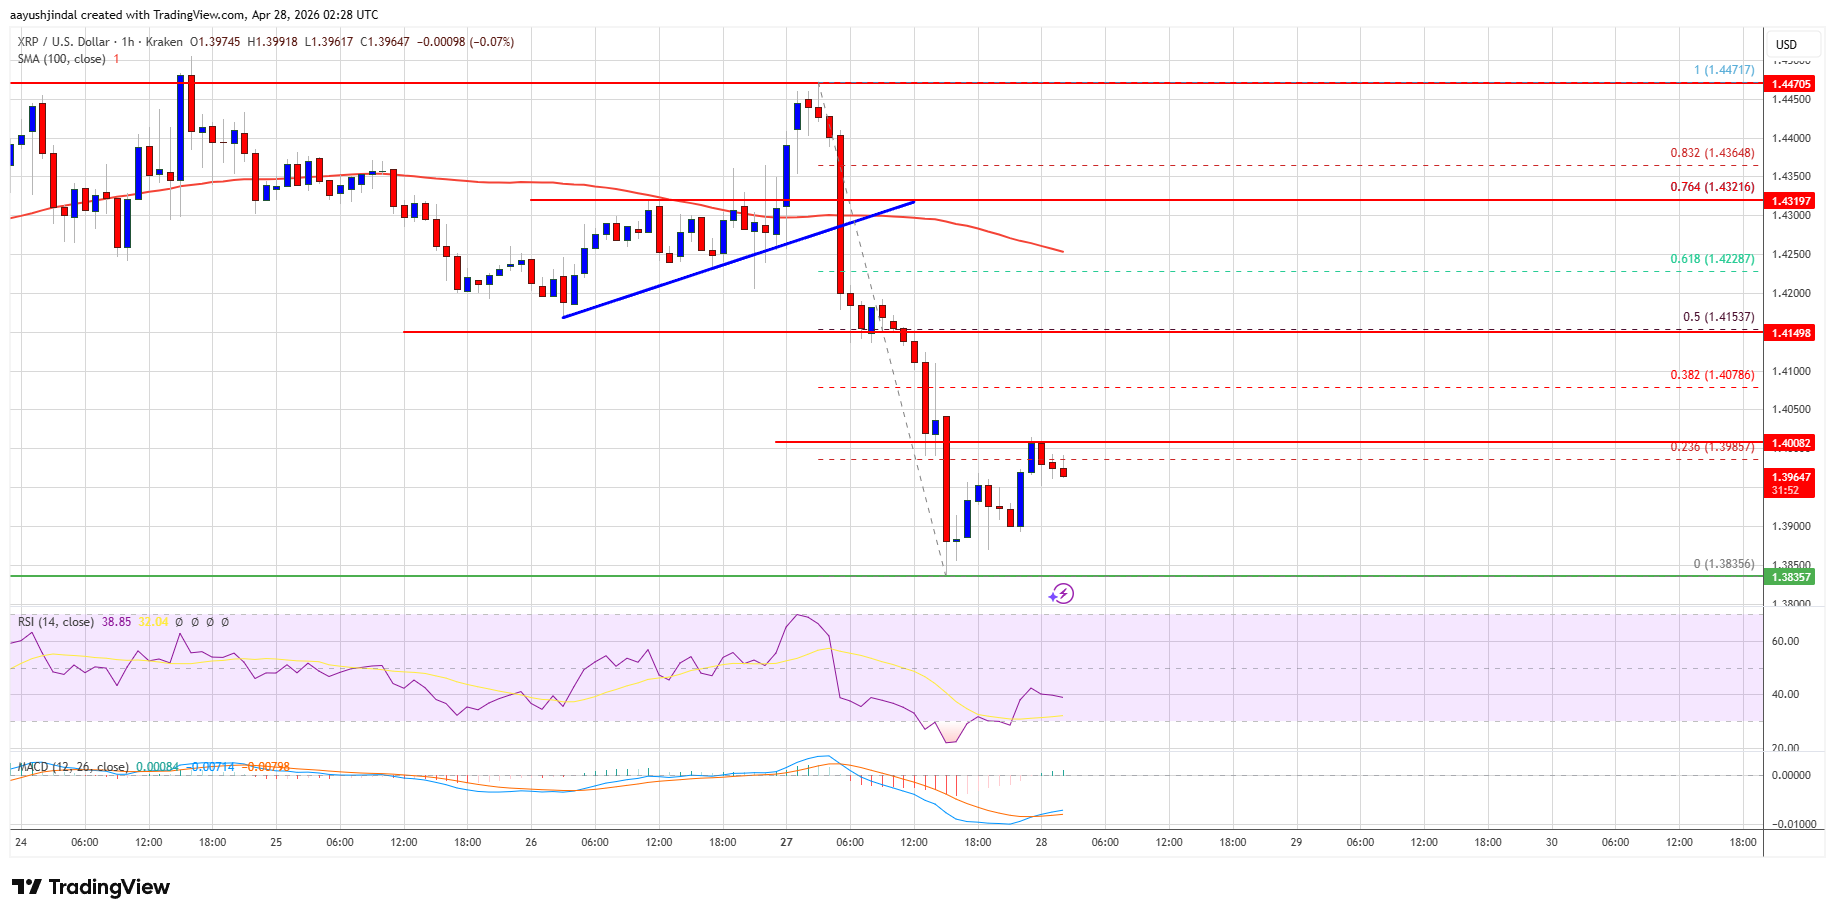
The first major resistance is near the $1.4150 level or the 50% Fib retracement level of the downward move from the $1.4471 swing high to the $1.3835 low. The main resistance could be $1.4250. A close above $1.4250 could send the price to $1.4320. The next hurdle sits at $1.4450. A clear move above the $1.4450 resistance might send the price toward the $1.450 resistance. Any more gains might send the price toward the $1.4650 resistance.
More Losses?
If XRP fails to clear the $1.4150 resistance zone, it could start a fresh decline. Initial support on the downside is near the $1.3920 level. The next major support is near the $1.3840 level.
If there is a downside break and a close below the $1.3840 level, the price might continue to decline toward $1.3650. The next major support sits near the $1.350 zone, below which the price could continue lower toward $1.3220.
Technical Indicators
Hourly MACD – The MACD for XRP/USD is now gaining pace in the bearish zone.
Hourly RSI (Relative Strength Index) – The RSI for XRP/USD is now below the 50 level.
Major Support Levels – $1.3920 and $1.3840.
Major Resistance Levels – $1.4150 and $1.4250.


Read More

XRP Price Slides Sharply Lower As Selling Pressure Intensifies Rapidly
