Ethereum (ETH) Battles Below $4K: Will the Bulls Turn the Tide or Let It Stay Stuck?

Share:
Predictions Markets
See what traders are focused on

- Ethereum is currently hovering around the $3.9K price range.
- The ETH market has experienced $159.44 million in liquidations.
With a 2.13% dip, the global crypto market cap has settled at $3.68 trillion and started the new trading day with fear sentiment. All the major assets have lost momentum and charted in red, including the largest asset, Bitcoin (BTC), which has slipped below the $110K, and currently trades at around $108.6K.
Meanwhile, the largest altcoin, Ethereum (ETH), is hovering within the deep bearish zone, where the asset has dropped beneath $4K. Earlier, ETH had been in a sturdy bearish trend, struggling to cross over the $4K threshold. As of October 17, the asset has backtracked into the deep negative zone.
Only a steady bullish correction can save ETH from the bearish trap. In the early hours, following a 2.42% drop, the altcoin traded at around $4,079.65. The bearish shift has triggered the price to fall to a low of $3,829.65. As per CMC data, at the time of writing, Ethereum traded within the $3,929.18 mark.
The asset’s market cap has touched $470.63 billion, with the daily trading volume staying at $48.42 billion after a brief spike. Besides, the market has experienced a liquidation event of $159.44 million worth of Ethereum during the last 24 hours, as reported by the Coinglass data.
Technical Data Points to Negative Sentiment for Ethereum Price
The technical chart of the ETH/USDT pair shows a bearish pattern. Both the MACD line and the signal line are below the zero line. This shows the market is currently bearish with weak momentum. The downtrend is likely to continue until a bullish crossover happens.
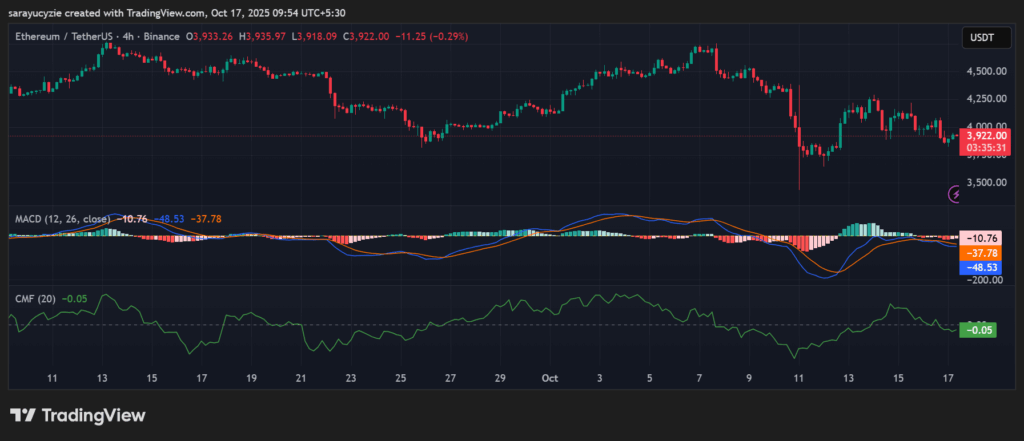
In addition, the CMF of Ethereum at -0.05 is slightly negative. It suggests mild selling pressure in the market. Notably, this momentum is not strong enough to confirm a major bearish trend yet. Also, more money is leaving the asset than entering it, a loss of momentum.
With the red candle formation, the negative outlook is present, and the ETH price might test the nearby support at $3,921. An extended downside correction opens the door to a deeper loss below $3.9K. If the altcoin rebounds, the price could climb to the $3,937 level. Assuming the bullish pressure gains more strength, Ethereum might move above the $3,945 mark.
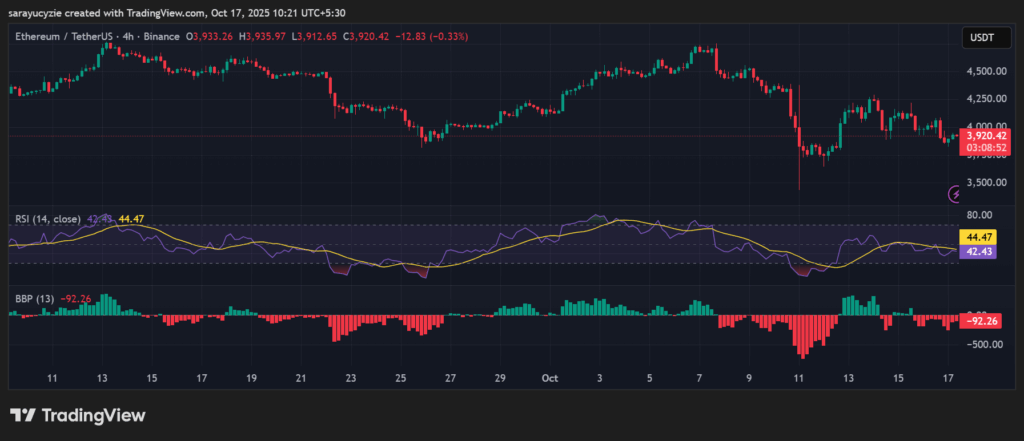
Ethereum’s daily RSI is at 42.43, signalling its neutral to mildly bearish territory. The market is showing weak buying pressure. Moreover, the BBP reading found at -92.26 implies that the bearish momentum is dominating the market, pushing the price down. Unless it turns positive, the trend is likely to remain bearish.
The 4-hour price chart shows the signs of bears ruling the asset. More losses would send ETH into more trouble, making the recovery hard. A reverse may help the asset regain the lost momentum. To get a clearer and deeper view of Ethereum’s future trajectory, explore our comprehensive ETH Price Predictions for 2025, 2026, and beyond to 2030.
Top Updated Crypto News
Support on the Line: Will OFFICIAL TRUMP (TRUMP) Hold Steady or Slip Further?
In This News
Coins

$ 63.77K
-0.15%
$ 0.0714
-3.90%
$ 1.80K
+0.54%
$ 0.99937
+0.01%
$ 0.00...361


Predictions Markets
See what traders are focused on
Share:
In This News
Coins
$ 63.77K
-0.15%$ 0.0714
-3.90%$ 1.80K
+0.54%$ 0.99937
+0.01%$ 0.00...361
Predictions Markets
See what traders are focused on
Share:
Read More
Bitcoin, XRP, DOGE Rise as US-Iran Technical Talks to Continue Despite Strikes