Ethereum (ETH) Struggles Below $2,100 as Market Sell-Off Deepens

Share:
Predictions Markets
See what traders are focused on

- Ethereum (ETH) fell 10.51% to $2,102.21, with market cap down 10.44% to $253.5B.
- Whale activity adds volatility, with $81M in unrealized profit from ETH shorts.
Ethereum (ETH) is under selling pressure, mirroring the broader crypto market downturn. The global market cap has dropped 8.04% to $2.76 trillion, while total market volume has declined 10.59% to $179.83 billion in the past 24 hours.
ETH is currently trading at $2,102.21, marking a 10.51% decline in the past day. The market cap has dropped 10.44% to $253.5 billion, and trading volume fell 10.06% to $34.87 billion. The fully diluted valuation (FDV) remains at $253.62 billion, with a total circulating supply of 120.59 million ETH.
A whale who shorted ETH with 50x leverage is now sitting on $81 million in unrealized profit. The whale has begun closing some short positions, securing profits amid ETH’s decline.
Can Ethereum Break Above $2,200 Resistance?
ETH faces immediate resistance at $2,200. If bulls break this level, the next target could be $2,350, followed by $2,500 in an extended rally. On the downside, support stands at $2,000. A breakdown below this level could push ETH toward $1,950, with further selling pressure potentially dragging it to $1,850.
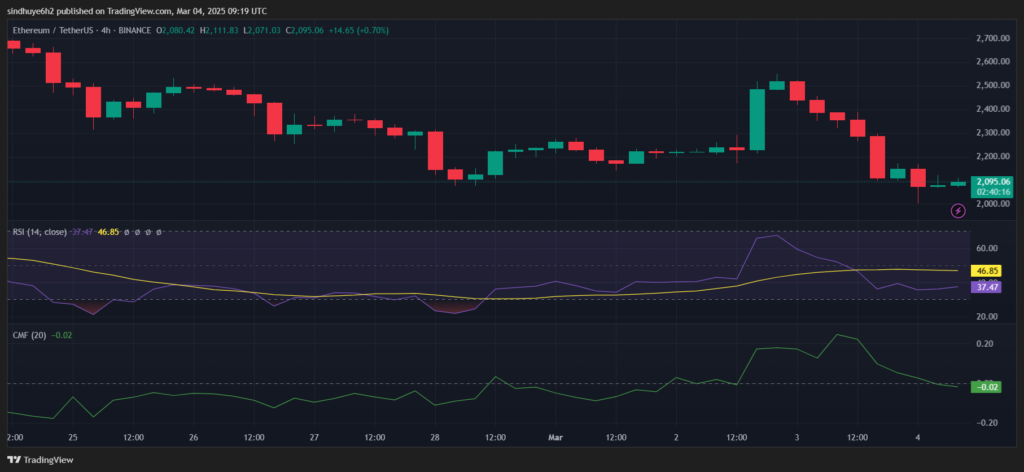
The RSI (14, close) is at 37.47, reflecting oversold conditions. The RSI average is at 46.85, indicating that ETH has been weakening over time. A move above 50 could signal renewed buying momentum, while further decline may confirm continued bearishness.
The CMF (20) stands at -0.02, suggesting weak capital inflows. A negative CMF implies declining buying pressure, making it harder for ETH to sustain an uptrend. The 50-period moving average (MA) is positioned above the price, reinforcing short-term bearish sentiment. The 200-period MA suggests that ETH remains in a broader downtrend.
A potential crossover between short and long-term MAs could determine ETH’s direction. If the 50-MA crosses below the 200-MA, it would confirm a bearish continuation. Conversely, a bullish crossover could indicate a trend reversal. ETH’s future depends on whether it holds $2,000 support or reclaims $2,200 resistance.
In This News
Coins

$ 64.15K
+1.62%
$ 1.79K
+2.90%
$ 0.00729
+2.67%
$ 3.46

$ 77.87
-0.54%

Predictions Markets
See what traders are focused on
Share:
In This News
Coins
$ 64.15K
+1.62%$ 1.79K
+2.90%$ 0.00729
+2.67%$ 3.46
$ 77.87
-0.54%Predictions Markets
See what traders are focused on
Share:
Read More

Founders Debate Ethereum L2 Value After Robinhood Chain Launch