XRP Price Meets Resistance, Tough Challenge Caps Upside Momentum

Share:
XRP is recovering in crypto markets, trading above $1.3350 and the 100‑hour SMA with hourly RSI >50 and MACD turning bullish; a contracting triangle caps near $1.3470. Key bullish trigger: a close above $1.380 (50% Fib) targeting $1.40 → $1.4120 → $1.4450; failure to hold $1.316–$1.300 risks declines to $1.2880, $1.2680 and $1.2320. (token performance, technical indicators, resistance/support)
Predictions Markets
See what traders are focused on

XRP price started a recovery wave above $1.3120 and $1.320. The price is now consolidating and might aim for a fresh move above $1.360.
- XRP price started a recovery wave above the $1.320 zone.
- The price is now trading above $1.3350 and the 100-hourly Simple Moving Average.
- There is a contracting triangle forming with resistance at $1.3470 on the hourly chart of the XRP/USD pair (data source from Kraken).
- The pair could continue to move up if it settles above $1.380.
XRP Price Aims Steady Gains
XRP price remained supported above $1.290 and started a recovery wave, like Bitcoin and Ethereum. The price was able to climb above $1.3120 and $1.320 to enter a short-term positive zone.
There was also a move above the 23.6% Fib retracement level of the downward move from the $1.4650 swing high to the $1.2836 swing low. The bulls even pushed the price above $1.340 but they struggled near $1.3780. The price is now trading above $1.3350 and the 100-hourly Simple Moving Average.
If there is a fresh upward move, the price might face resistance near the $1.3480 level. There is also a contracting triangle forming with resistance at $1.3470 on the hourly chart of the XRP/USD pair.
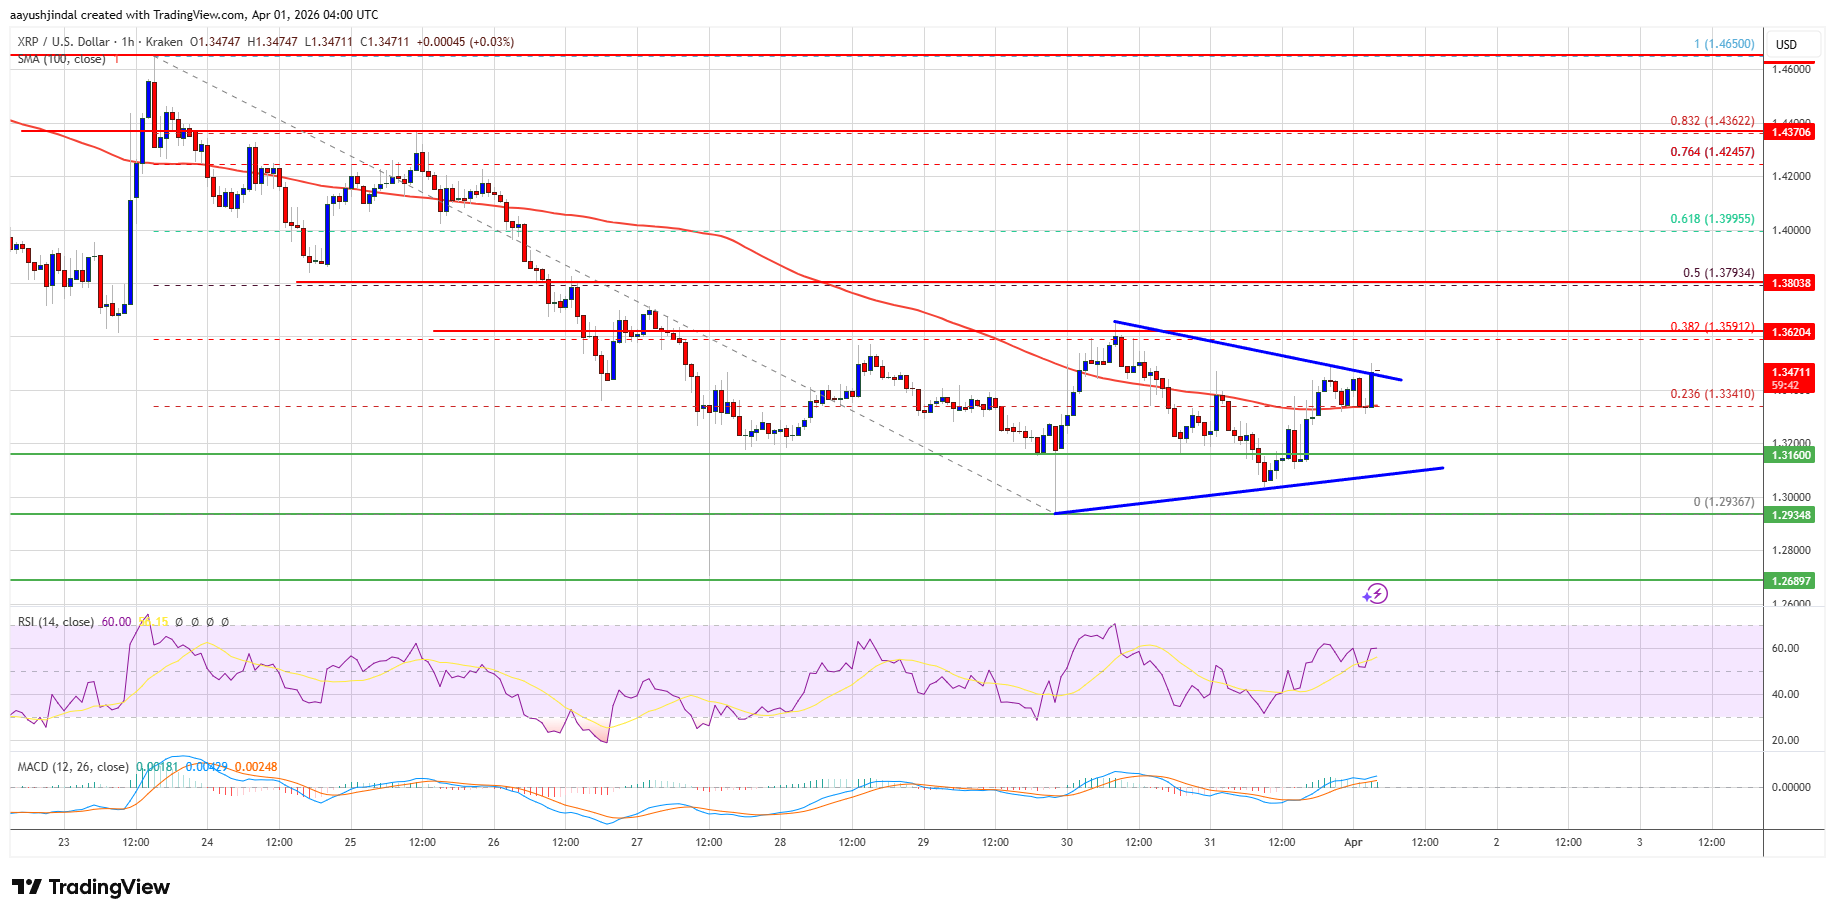
The first major resistance is near the $1.380 level or the 50% Fib retracement level of the downward move from the $1.4650 swing high to the $1.2836 swing low. A close above $1.380 could send the price to $1.40. The next hurdle sits at $1.4120. A clear move above the $1.4120 resistance might send the price toward the $1.4250 resistance. Any more gains might send the price toward the $1.4450 resistance.
Another Drop?
If XRP fails to clear the $1.380 resistance zone, it could start a fresh decline. Initial support on the downside is near the $1.3150 level. The next major support is near the $1.30 level.
If there is a downside break and a close below the $1.30 level, the price might continue to decline toward $1.2880. The next major support sits near the $1.2680 zone, below which the price could continue lower toward $1.2320.
Technical Indicators
Hourly MACD – The MACD for XRP/USD is now gaining pace in the bullish zone.
Hourly RSI (Relative Strength Index) – The RSI for XRP/USD is now above the 50 level.
Major Support Levels – $1.3160 and $1.3000.
Major Resistance Levels – $1.3800 and $1.4120.


Read More

XRP Price Tumbles Under $1.22 As Market Sentiment Turns Sour