Why is XRP falling even as institutional ETF inflows turn positive?

Share:
XRP fell to about $1.11 on June 5, its lowest since Feb 6, extending a six-session losing streak even as institutional XRP ETF flows flipped to a $4 million inflow on Thursday after $5 million of outflows the prior day; cumulative ETF inflows stand at $1.5 billion with AUM above $1 billion. Broader crypto weakness—Bitcoin briefly at $61,100 and Ethereum at risk of dropping below $1,500—plus geopolitical uncertainty and a Crypto Fear & Greed Index of 17 have left XRP below the 50/100/200-day EMAs with RSI 30 and negative MACD, keeping downside toward the $1.00 support likely unless ETF-driven demand or a daily close above $1.34 triggers a reversal.
Predictions Markets
See what traders are focused on

The cryptocurrency market has continued its negative performance this week, with Bitcoin, Ethereum, and XRP extending their losses.
Bitcoin briefly touched the $61,100 level, while Ethereum risks dropping below $1,500 in the near term.
Meanwhile, Ripple’s XRP is trading around $1.11 on Friday, marking its lowest level since February 6 and extending its losing streak to six consecutive sessions.
The decline reflects continued weakness across the broader crypto market amid heightened geopolitical uncertainty and fading investor confidence.
XRP ETF inflow resumes, but price action remains weak
Institutional flows into XRP investment products have flipped positive, with approximately $4 million in inflows recorded on Thursday.
This was after $5 million in outflows were recorded the previous day.
The outflow on Wednesday was the first one since April 30, indicating that institutional interest in XRP remains strong despite the current bearish price action.
Cumulative figures still show strong longer-term participation. Total inflows into XRP ETFs stand at $1.5 billion, with assets under management above $1 billion.
The shift suggests that the weak short-term sentiment among investors didn’t last, as they remain bullish on XRP.
If the inflows persist, it could pave the way for XRP to rally higher once the market selloff ends.
However, XRP is approaching the critical $1.0 support level, which could see it drop towards lower demand zones.
Market participants continue to reduce exposure to risk assets as geopolitical tensions—particularly between the United States and Iran—fuel uncertainty across global markets.
Due to the current macroeconomic conditions, investors are moving their funds away from volatile assets like cryptocurrencies and toward safer instruments such as bonds, gold, and cash equivalents.
CoinMarketCap data reinforces this cautious positioning, with the Crypto Fear & Greed Index sitting at 17 (Extreme Fear), down sharply from 50 in May.
XRP technical outlook: XRP remains under heavy selling pressure
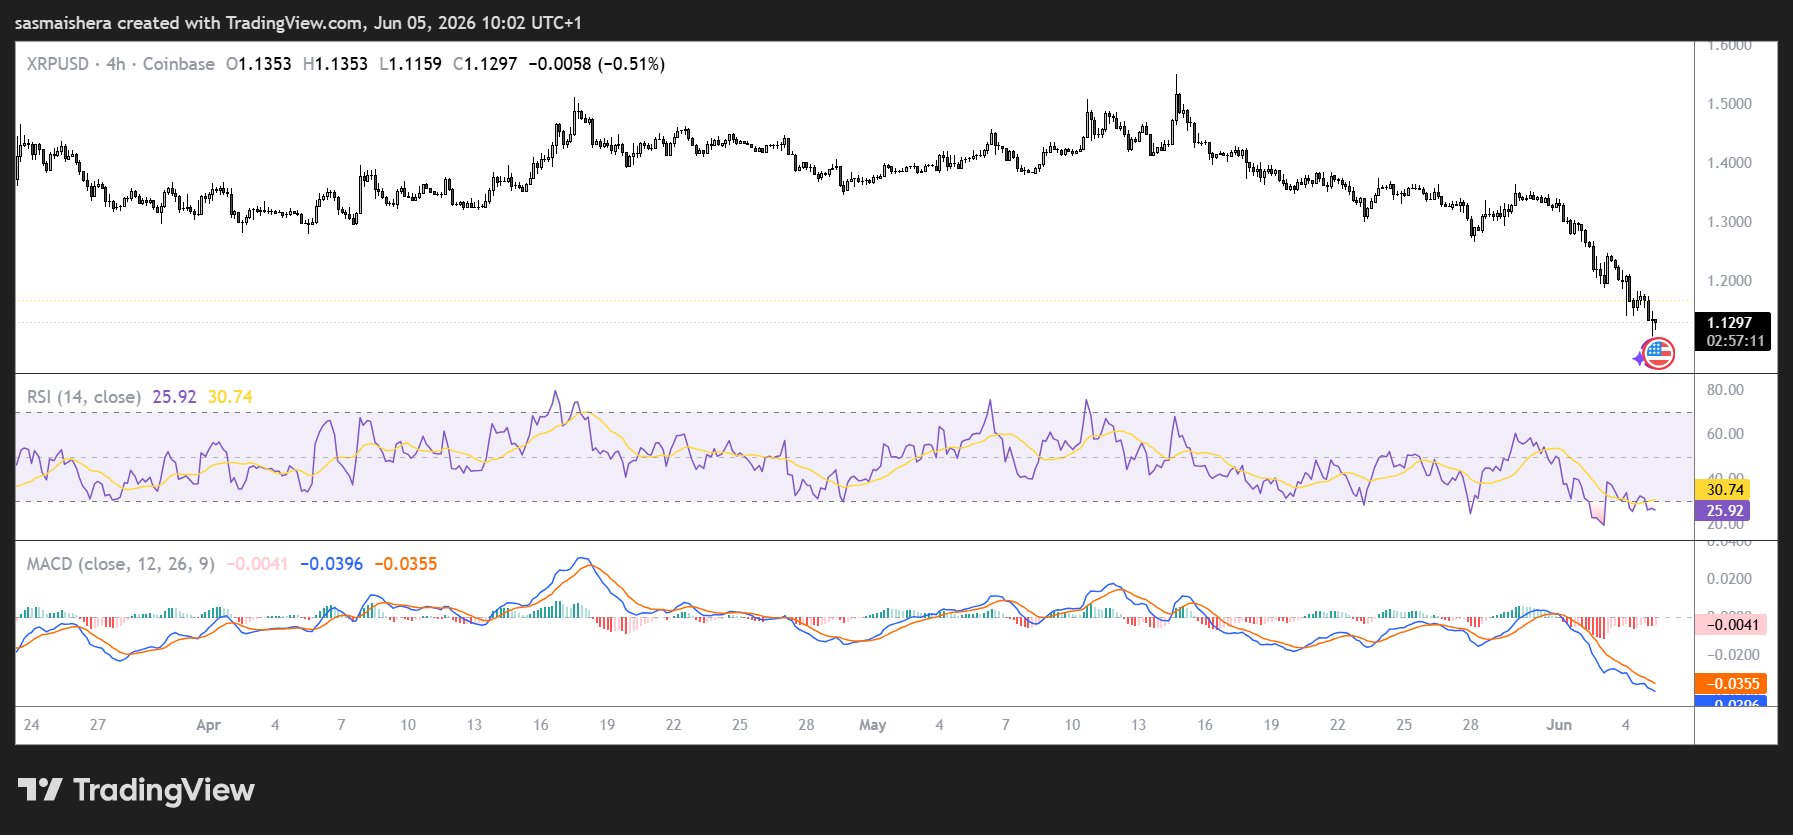
Similar to Bitcoin and Ethereum, the XRP/USD 4-hour chart is as XRP continues to trade below key long-term trend indicators, maintaining a clearly bearish structure.
At press time, XRP is trading at $1.116, below the 50-day, 100-day, and 200-day EMAs. Meanwhile, the SuperTrend resistance sits at $1.34, capping recovery efforts in the near term.
The technical indicators also showcase an oversold condition. The Relative Strength Index of 30 means that XRP has officially entered the oversold territory.
The MACD histogram remains negative, confirming downward momentum.
While oversold conditions may slow the pace of decline, they have not yet triggered a meaningful reversal.
If the market conditions improve, the bulls would encounter the first major resistance at $1.34, which coincides with the Transactional Liquidity (TLQ) level on the 4-hour chart.
A daily candle close above this level could see XRP target the higher resistance levels at $1.36 (50-day EMA), $1.44 (100-day EMA), and $1.64 (200-day EMA).
A sustained recovery above these levels would be required to shift the broader bearish outlook.
However, if the selloff persists, XRP could drop below the $1.0 psychological level.
A decisive break below this level could pave the way for accelerated downside pressure in the near term.
The post Why is XRP falling even as institutional ETF inflows turn positive? appeared first on Invezz


Read More

XRP price holds above $1.10 as Bollinger Bands indicate a potential rally to $2