How to Read the Spot CVD Chart for BTC/USDT on Aug. 10

Share:
On Aug. 10 the Spot CVD chart for BTC/USDT provides crypto traders a combined volume heatmap and cumulative volume delta view to identify buying and selling pressure and potential support and resistance in a relatively narrow trading range. The tool breaks order flow by size — yellow line for $100 to $1,000 and brown for $1 million to $10 million — helping spot retail versus institutional accumulation or distribution, though it should be used with other analysis, risk management and market context.
Predictions Markets
See what traders are focused on

BitcoinWorld
How to Read the Spot CVD Chart for BTC/USDT on Aug. 10
On Aug. 10, traders monitoring the BTC/USDT spot market can use the Spot CVD chart to gauge buying and selling pressure in real time. This chart, which combines a volume heatmap with cumulative volume delta (CVD), offers a detailed view of order flow dynamics that can help identify potential support and resistance levels.
Understanding the Volume Heatmap
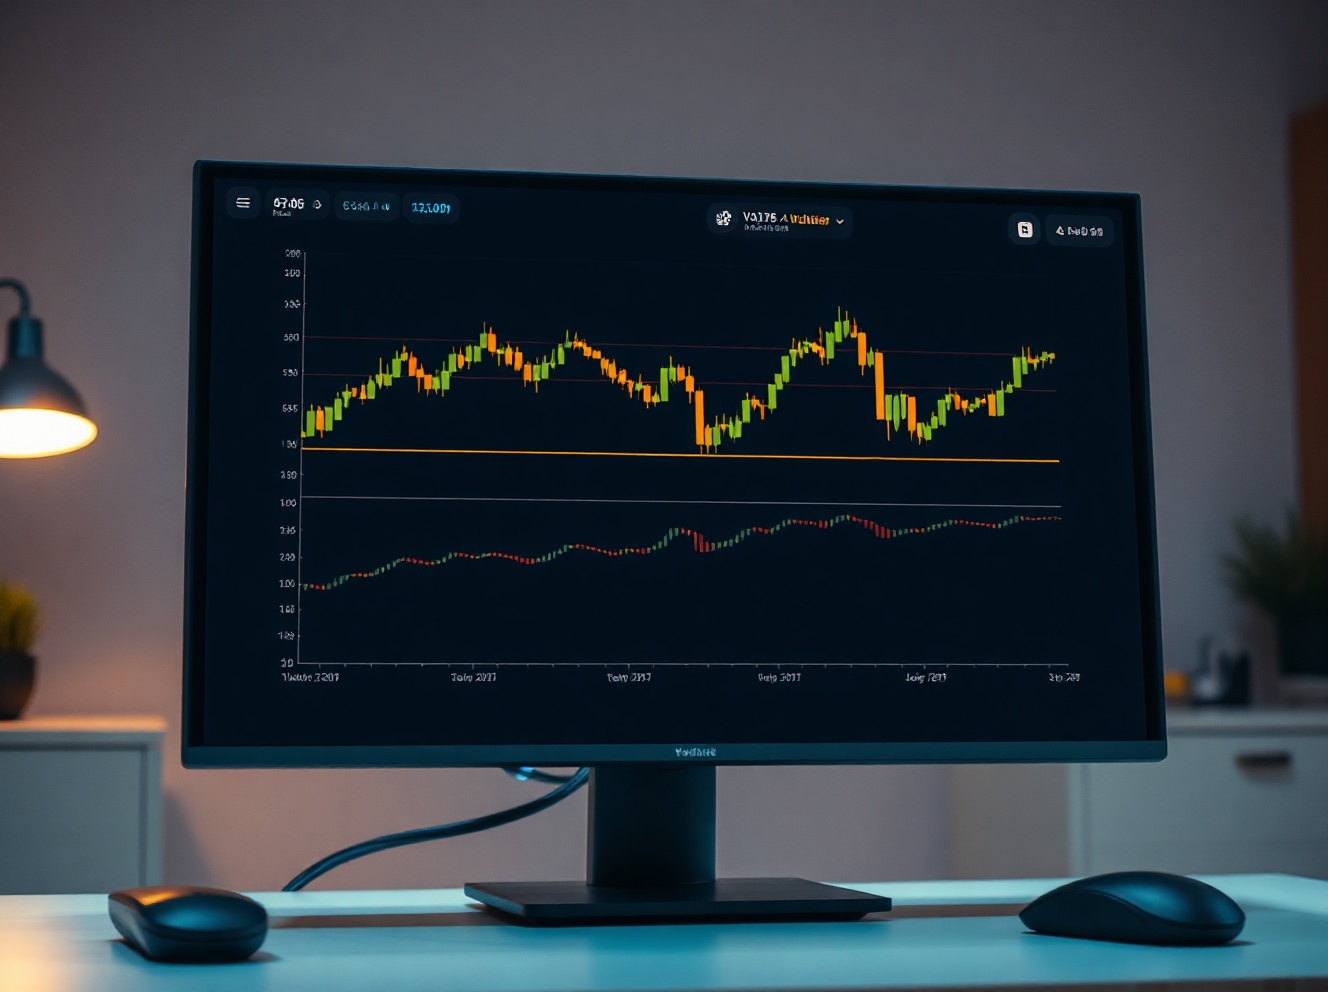
The upper section of the Spot CVD chart displays a volume heatmap, which tracks trading activity at various price levels. The background color intensifies when the price remains within a specific range for an extended period or when it moves sharply. Brighter zones indicate higher trading volume, which often act as support or resistance areas. For instance, a bright cluster below the current price may suggest strong buying interest, while a bright zone above could signal selling pressure.
Cumulative Volume Delta (CVD) Explained
The lower section of the chart shows the cumulative volume delta, an indicator that reflects the net difference between buy and sell orders, categorized by capital size. When buy orders dominate, the corresponding line rises; when sell orders increase, the line falls. The chart uses different colored lines to represent order sizes: the yellow line tracks orders between $100 and $1,000, while the brown line represents large orders between $1 million and $10 million. These distinctions help traders understand whether retail or institutional players are driving the market.
Why This Matters for Traders
For active traders, the Spot CVD chart provides a granular view of order flow that can complement traditional price analysis. By observing shifts in CVD alongside the volume heatmap, traders can identify moments of accumulation or distribution, which may precede price movements. On Aug. 10, as Bitcoin trades within a relatively narrow range, such insights could be particularly valuable for short-term strategies.
Context and Market Implications
The use of order-book analytics has grown among crypto traders, especially during periods of low volatility when price action alone offers limited signals. Tools like the Spot CVD chart are part of a broader trend toward data-driven trading, where volume and order flow are prioritized over simple price charts. However, it is important to note that no single indicator is foolproof, and traders should use these tools in conjunction with other forms of analysis, including fundamental news and market sentiment.
Conclusion
The Spot CVD chart for BTC/USDT on Aug. 10 offers a detailed look at market microstructure, combining volume heatmap and cumulative volume delta to reveal buying and selling pressure by order size. While it provides valuable insights, traders should remain aware of its limitations and use it as part of a comprehensive strategy. As always, market conditions can change rapidly, and past performance is not indicative of future results.
FAQs
Q1: What does the volume heatmap indicate?
The volume heatmap shows trading activity at different price levels. Brighter colors indicate higher volume, which can signal strong support or resistance zones.
Q2: How is cumulative volume delta calculated?
CVD is the cumulative sum of the difference between buy and sell orders, often weighted by order size. It shows whether buyers or sellers are more aggressive over time.
Q3: Can the Spot CVD chart predict price movements?
No indicator can predict price movements with certainty. The Spot CVD chart helps traders understand order flow, but it should be used alongside other analysis methods and risk management practices.
This post How to Read the Spot CVD Chart for BTC/USDT on Aug. 10 first appeared on BitcoinWorld.


Read More
BTC/USDT Order-Book Snapshot: Volume Heatmap and CVD Signal Key Levels