BTC/USDT Order-Book Snapshot: Volume Heatmap and CVD Signal Key Levels
Share:
On Aug. 10 at 12:00 UTC BitcoinWorld published a BTC/USDT order-book snapshot showing a volume heatmap by price range and a cumulative volume delta (CVD) panel that breaks order flow by size, with the yellow line tracking $100–$1,000 trades and the brown line tracking $1M–$10M trades. The piece notes bright heatmap clusters as likely short-term support/resistance and that rising CVD in larger order tiers can signal institutional accumulation and potential upward momentum, information useful for crypto traders monitoring CEX and DEX liquidity, token launch or fundraising flow and adoption while still requiring broader market research, security checks and risk management.
Predictions Markets
See what traders are focused on

BitcoinWorld
BTC/USDT Order-Book Snapshot: Volume Heatmap and CVD Signal Key Levels
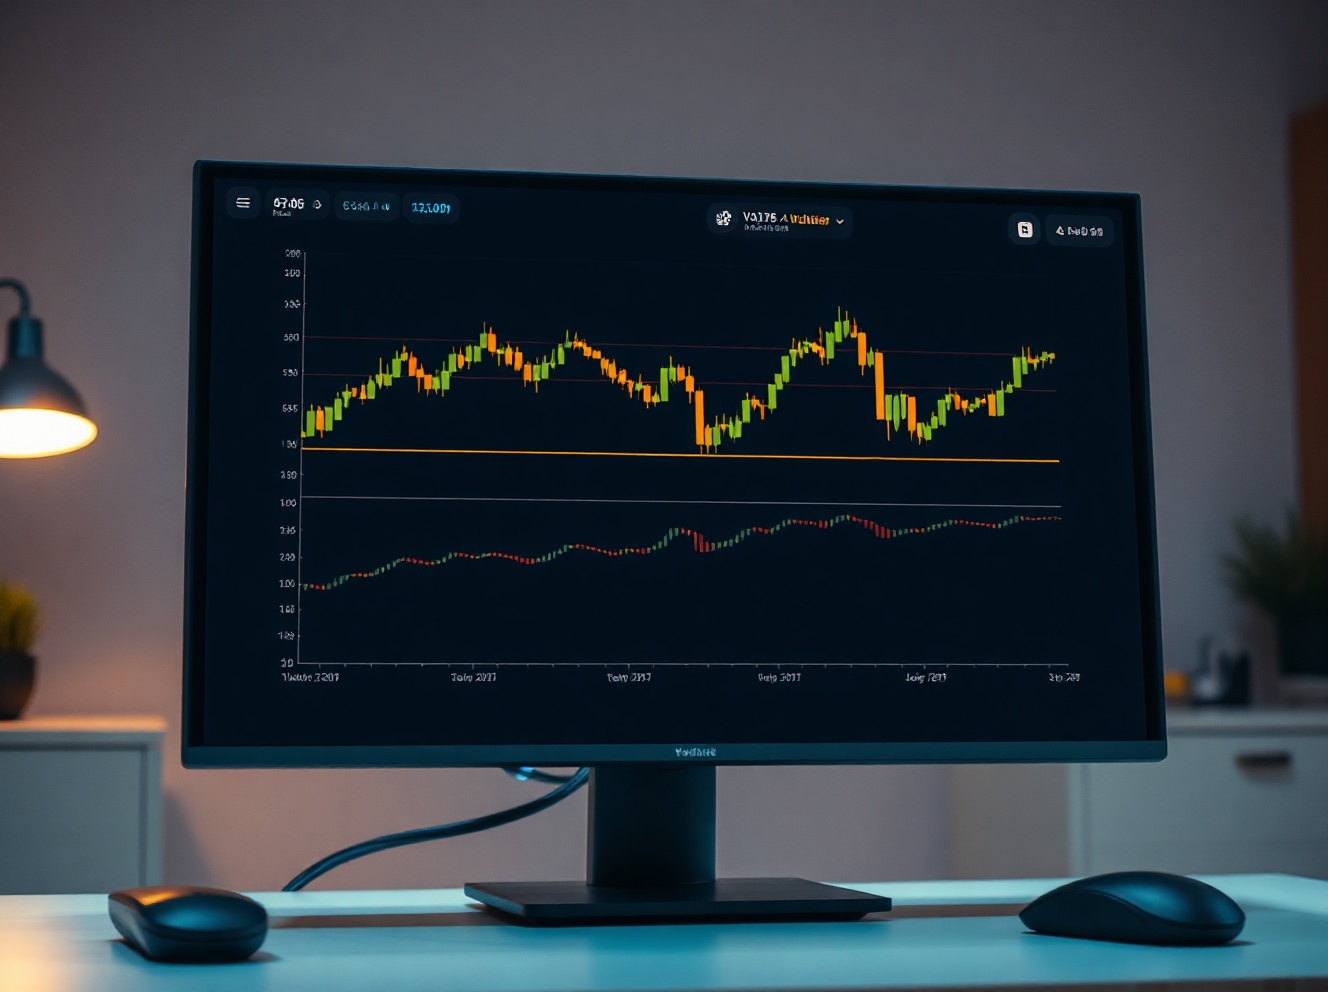
On Aug. 10 at 12:00 a.m. UTC, the BTC/USDT spot market presented a detailed order-book snapshot, with the upper panel displaying a volume heatmap and the lower panel tracking cumulative volume delta (CVD). This data offers traders a granular view of where buying and selling pressure has concentrated over recent sessions, potentially highlighting key support and resistance zones.
Volume Heatmap: Identifying Price Levels of Interest
The volume heatmap in the upper panel aggregates trading activity by price range, with brighter zones indicating areas where the price has either lingered for an extended period or executed significant moves. These bright regions often act as magnets for price action, serving as potential support or resistance levels. For BTC/USDT, the current heatmap suggests that several price clusters have formed, which could influence short-term trading decisions.
CVD Indicator: Gauging Order-Flow Imbalance
The lower panel’s cumulative volume delta (CVD) measures the net difference between buying and selling volume, broken down by order size. Each colored line represents a specific order-size category, rising when buy orders dominate for that tier. The yellow line tracks orders between $100 and $1,000, while the brown line monitors large orders between $1 million and $10 million. The divergence or convergence of these lines can reveal whether retail or institutional-sized participants are driving the market.
What This Means for Traders
For active traders, this order-book analysis provides a real-time pulse of market sentiment. A rising CVD, especially in the larger order categories, often signals institutional accumulation, which may precede upward momentum. Conversely, a falling CVD could indicate distribution. The volume heatmap adds a layer of context, helping traders identify price levels where significant liquidity sits, which can act as barriers or launchpads for future moves.
Conclusion
This Aug. 10 snapshot of BTC/USDT spot trading, with its volume heatmap and CVD breakdown, offers a practical tool for understanding current market dynamics. While no single indicator is infallible, combining these data points helps traders gauge where the next significant price reaction might occur. As always, such technical analysis should be used alongside broader market research and risk management strategies.
FAQs
Q1: What is cumulative volume delta (CVD)?
CVD is a technical indicator that tracks the cumulative difference between buying and selling volume, often broken down by order size, to show whether buyers or sellers are more aggressive.
Q2: How does the volume heatmap help in trading?
The volume heatmap displays trading activity by price range, with brighter areas indicating higher volume. These zones often act as support or resistance, helping traders anticipate price movements.
Q3: Why are large order sizes significant in CVD analysis?
Large orders (e.g., $1M–$10M) typically represent institutional activity. Their behavior can signal accumulation or distribution, which may influence market trends more than retail-sized trades.
This post BTC/USDT Order-Book Snapshot: Volume Heatmap and CVD Signal Key Levels first appeared on BitcoinWorld.


Read More

Bitcoin Price USD Eyes Liquidity Squeeze as $67K Resistance Looms