Bitcoin’s first institutional bear market is starting to take shape and draining liquidity
Share:
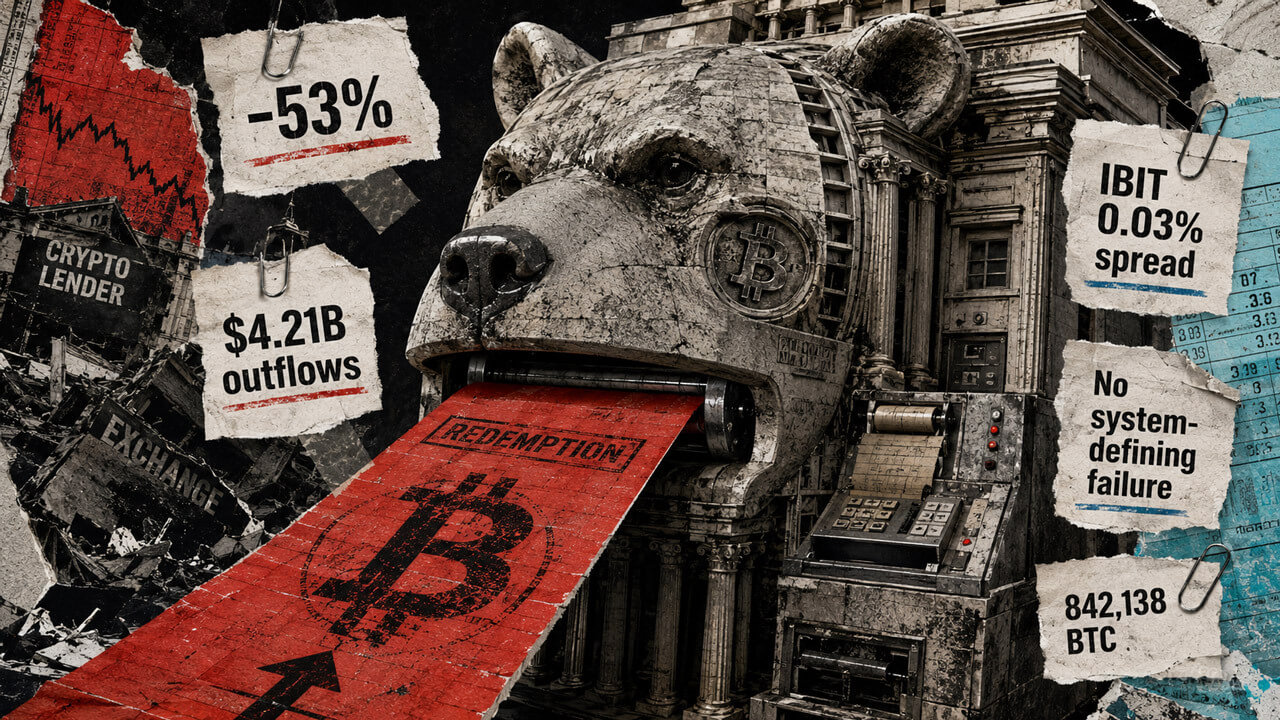
Bitcoin is moving through an institutional bear market as spot ETF redemptions and shrinking liquidity drove a roughly 51–53% drawdown from the October 2025 peak of $126,223 to a July 2026 low near $59,000, with $3.3–4.21 billion of ETF outflows through June and realized capitalization down to $1.07 trillion. Regulated custody and ETFs have enabled orderly exits—evidenced by MicroStrategy selling 1,638 BTC for $104.73 million and authorizing up to $1.25 billion of sales—reducing forced liquidations but risking prolonged weakness for crypto market liquidity, adoption and token performance across CEX, DEX and DeFi channels.
Predictions Markets
See what traders are focused on

In an institutional bear market, a Bitcoin ETF redemption is almost aggressively boring. An investor sells shares, an authorized participant returns a large block to the trust, and the fund either pays cash or transfers BTC. Its assets shrink while the shares keep trading near net asset value and the custodian carries on.
Since the SEC approved in-kind redemptions in July 2025, the coins themselves can leave through this process without forcing the trust to sell them on the market.
In 2022, the exit often began with a disabled withdrawal page and ended in bankruptcy court. But now, in 2026, it can begin with a portfolio rebalance and end on an account statement. The fund gets smaller, a source of demand fades, and, depending on how the redemption is handled and hedged, selling can appear elsewhere in the market.
The machine keeps working while the investor takes the loss.
That difference is getting harder to dismiss. Bitcoin reached $126,223 in October 2025, traded below $59,000 on July 1 and recovered to roughly $64,000 in early August. The deepest leg erased about 53%, and the price was still down almost half from its peak at the start of this week. Reuters calculated a 33% loss for 2026 by early June, Bitcoin's worst start to a year in more than a decade.
A drop that large qualifies as a bear market under any useful definition. It has also left the biggest investment products, custodians and market makers functioning normally.
Bitcoin may be going through its first institutional bear market, one in which Wall Street distributes losses efficiently enough to keep any single failure from defining the entire decline.
The crash moved to the redemption desk
Most of the previous Bitcoin bear markets came with easy villains. The 2018 one followed the initial coin offering boom and erased about 84% from the price in a market still dominated by retail buyers. The 2021–2022 one cut Bitcoin by roughly 77%, then moved through the balance sheets of Terra, Three Arrows Capital, Celsius, Voyager, BlockFi and FTX.
A Federal Reserve review of the 2022 collapse traced how Terra's failure damaged Three Arrows, whose defaults then struck the lenders that had financed it. Falling collateral triggered margin demands and forced sales. Withdrawal freezes sent customers running for whatever cash they could recover, pushing more firms toward court. Every broken institution made the remaining ones look weaker.
The current cycle has delivered a different mix of causes and conditions. Galaxy Research measured the drawdown at 51% by June 9, eight months from the peak, while each of the previous two cycles took roughly 12 months to travel from the top to the bottom.
The later move below $59,000 added another two percentage points. This decline is shallower so far, and it is passing through far larger institutional channels.
| Metric | 2018 | 2022 | 2025–2026 |
|---|---|---|---|
| Peak-to-trough drawdown | 84% | 77% | 51% through June 9; about 53% at the July low |
| Time from peak to low, or to June 9 | About 12 months | About 12 months | 8 months and ongoing |
| Major failures | ICO projects and small venues | Terra, 3AC, Celsius, Voyager, BlockFi and FTX | No system-defining intermediary failure through Aug. 5 |
| US spot ETF net flows | N/A | N/A | $3.3 billion of outflows through June 30 |
| Stablecoin supply | Too small for a useful comparison | Broad contraction during the credit unwind | Rose from $308 billion to $318 billion in Q1; 30-day rate near -2% by June 18 |
| Realized capitalization | Mild decline around the cycle low | Contracted into the cycle low | Down 1.45% over 90 days to $1.07 trillion on June 17 |
| Spot exchange volume | Venue coverage too limited | Broad contraction | Coin-denominated volume at its lowest since 2019 in late July |
| Public-company Bitcoin exposure | Minimal | Limited | Strategy alone held 842,138 BTC on Aug. 2 |
Drawdown and duration figures use Galaxy's cycle study, with the current low updated from Reuters. Current realized-cap and market-activity readings come from Glassnode. Source: Galaxy Research. The current cycle was ongoing at the June 9, 2026 cutoff.
Spot Bitcoin ETFs provide the clearest evidence of an institutional bear market. They saw $4.21 billion of outflows across three weeks by June 3, the largest redemption run of 2026, while the average ETF holder's cost basis stood near $83,000. Citi counted $3.3 billion of net outflows for the year through June and cut its 12-month flow assumption from $10 billion of inflows to zero.
But ETF outflows can’t be translated dollar-for-dollar into Bitcoin dumped on exchanges. Some investors sell ETF shares to other investors, leaving the fund’s holdings unchanged; when an authorized participant redeems shares, the fund may pay cash or hand over BTC that the participant can hold, hedge, or sell.
What the outflows do establish is that the ETF bid that helped carry Bitcoin higher had reversed. Capital was leaving the funds faster than it entered, so one of the market’s largest recent buyers was no longer absorbing supply.
BlackRock’s IBIT showed what makes this decline different from 2022. The fund still held $47.48 billion of net assets on Aug. 4, while its 0.03% median bid-ask spread allowed investors to trade close to the value of the underlying bitcoin. Shareholders took the losses and retained an easy route out as the fund continued operating normally.
That’s the institutional bear market in its simplest form: a large regulated product made Bitcoin easier to exit, allowing the retreat to unfold through daily trading and redemptions instead of frozen withdrawals and bankruptcy claims.
Why an institutional bear market can hurt for longer
Bitcoin's daily volume has been shrinking for years. Charles Schwab found that its 2025 historical volatility was 42%, roughly half the 2021 reading and below both Tesla and Nvidia.
Across the three years through February 2026, Bitcoin's maximum drawdown was 50%, close to Tesla's 54%, even though Bitcoin's day-to-day volatility was lower.
That combination explains why a deep loss can feel strangely uneventful. A leveraged crash crams selling into a few violent sessions, throws collateral onto exchanges, and gives everyone a date they can mark as capitulation.
An investment committee can cut a risk budget over several meetings. An adviser can lower a model allocation at the next rebalance, while an ETF holder can sell at any point during the trading day. The market can digest each sale and then return the next morning for another.
Fewer forced liquidations also remove the violent rallies that follow them. Once a heavily leveraged position is gone, its forced selling is gone too, and short sellers often cover into the wreckage. Gradual institutional selling offers less of that release. It can keep feeding the market for months because the decision comes from allocation rules, volatility limits and funding needs rather than a single margin call.
However, the real distress can still be seen in on-chain data. Glassnode found realized capitalization had fallen 1.45% over 90 days to $1.07 trillion by June 17, which means coins were moving at prices below their previous acquisition value. By July 8, long-term holders were realizing about $280 million of losses per day on a 30-day average, the highest since December 2022.
Panic and capitulation are present in this cycle; they're just spread across more holders and more weeks.
The state of the derivatives market this year also points to an institutional bear market. Glassnode found that the June break below $60,000 was led by spot selling while futures reacted, and open interest contracted as the price fell. Options dealers' hedging helped contain movement near large strike prices. Reduced leverage lowered the odds of one giant liquidation cascade, while spot owners retained plenty of capacity to sell.
ETF flows can't explain the full decline either. By late July, they had briefly turned positive and then slipped modestly negative, while spot volume measured in bitcoin had fallen to its lowest level since 2019. The institutional channel had stopped pushing the market down with the force seen in June, but it had failed to restore the bid that carried Bitcoin upward.
In a thin market, a missing buyer can do nearly as much damage as a new seller.
The corporate bid became a corporate bill
Public treasury companies form the more fragile bridge between the old and new regimes. During the boom, their shares offered leveraged Bitcoin exposure, while management teams issued stock or debt and used the proceeds to buy more coins. The trade fed itself as long as the shares commanded a premium to the value of the treasury.
Falling prices reverse that loop well before bankruptcy even becomes a concern. The premium shrinks, new issuance becomes punishing for existing shareholders, and what was once a dependable Bitcoin buyer disappears. The lost purchases affect the market first; actual coin sales can come later, once dividends, interest or debt repayment require cash.
Strategy has already crossed that line. An Aug. 3 SEC filing showed that the company sold 1,638 BTC for $104.73 million during the previous week, using half for preferred dividends and half to repurchase its STRC preferred stock. It retained 842,138 BTC acquired for $63.51 billion, or $75,419 per coin.
A separate filing recorded an $8.32 billion second-quarter loss on digital assets, almost all of it unrealized, and the board has authorized up to $1.25 billion of Bitcoin sales to fund its dollar reserve.
While the sales are tiny beside Strategy's holdings, their purpose carries more weight than their size. Bitcoin accumulated during the boom is now servicing securities that helped finance the treasury structure. Smaller treasury companies have sold coins to repay obligations as well, pushing losses into common equity, dilution, and incremental Bitcoin sales.
The missing bankruptcies support several explanations. Regulated custody and daily fund liquidity have reduced the chance of a run among ETF holders, while common and preferred shareholders absorb losses that once landed on depositors. Treasury companies can sell early enough to avoid insolvency. Offshore leverage may also be harder to see, and a cycle only ten months past its peak still has time to produce a major failure.
This thesis gets weaker if offshore leverage rebuilds and ends in a 2022-sized liquidation wave, ETF redemptions prove minor beside retail spot selling, or a large intermediary fails as the decline ages. It gets stronger if volatility stays compressed, fund liquidity holds, treasury-company credit deteriorates, and capital keeps leaving through thousands of ordinary transactions instead of one fatal run.
The next warning may show up as an ETF cost basis that caps every rally, a treasury company trading below the value of its coins, or a preferred yield that closes another financing route.
Wall Street's arrival gave Bitcoin two efficient machines. One pulled capital in at astonishing scale. The other is now sending it back out, one redemption, rebalance, and corporate payment at a time.
The post Bitcoin’s first institutional bear market is starting to take shape and draining liquidity appeared first on CryptoSlate.


Read More

Top 3 Price Prediction: Bitcoin (BTC), Ethereum (ETH), XRP (XRP)