Ethereum (ETH) in the Danger Zone: Is a Drop Below $3K Imminent?

Share:
Predictions Markets
See what traders are focused on

- Ethereum is currently hovering around the $3.2K mark.
- ETH’s daily trading volume has surged by over 28%.
A broad bearish trap is dragging the crypto assets down, stalling momentum and delaying any potential rebound. The prices are in the red zone, slipping back to their recent lows. With the fear sentiment lingering across the market, the largest altcoin, Ethereum (ETH), is trading on the downside, registering a loss of over 5.66%.
The asset’s price movement is facing downside pressure, retraced beneath $3.3K, and sank to the previous support. According to the CMC data, ETH opened the day trading at around a high range of $3,583.34.With the potential bears taking the command, the price has steadily fallen to a bottom of $3,063.09.
At press time, Ethereum traded at around $3,292.50, with a market cap of $398.24 billion. In addition, the daily trading volume is up by over 28.71%, reaching $72.43 billion. The Coinglass data has reported that the market has seen a liquidation of $571.44 million worth of ETH during the last 24 hours.
Will Ethereum’s Downtrend Continue?
The four-hour trading pattern of the ETH/USDT pair is trapped in the bear hold, and the price could test the crucial support at $3,282. With the extended downside correction, the mighty bears might send the price to the $3,270 range or even lower.
If the tension of an uptrend awakens, the Ethereum price might move up to the immediate resistance levels at around $3,303 and $3,315. The altcoin’s steady bullish trajectory could even break past these ranges and send it to its former highs.
Ethereum’s Moving Average Convergence Divergence (MACD) line and the signal line are found below the zero line. It indicates that the overall momentum in the market is bearish. Even a short-term crossover is considered weak until both lines move above zero.
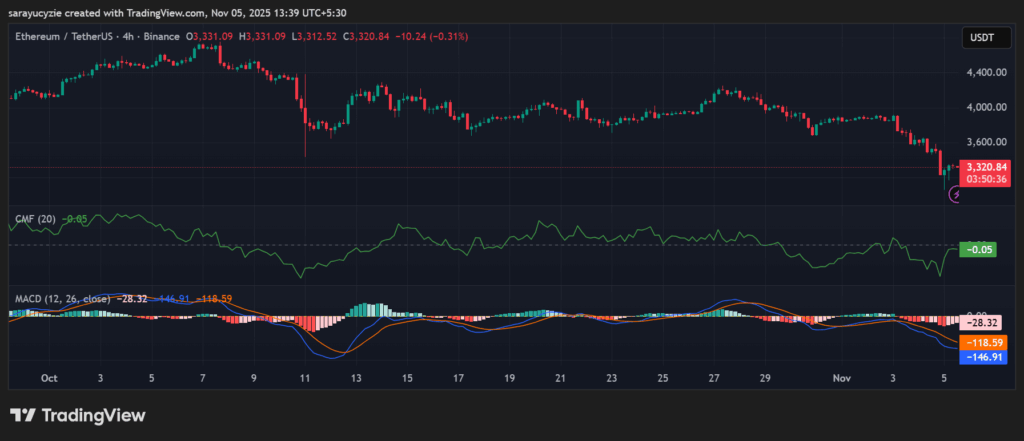
Besides, the Chaikin Money Flow (CMF) indicator of ETH is stationed at -0.05, suggesting slight selling pressure in the market. Notably, the money is flowing out rather than in, but the value is not deeply negative, so the bearish pressure is not very strong yet.
The daily Relative Strength Index (RSI) of Ethereum, staying at 28.13, is in the oversold territory. The asset might be undervalued and could possibly see a potential bounce. Moreover, ETH’s Bull Bear Power (BBP) reading of -307.63 signals strong bearish dominance. Notably, the more negative the value, the greater the selling pressure.
Top Updated Crypto News
Make-or-Break Moment: Can Bitcoin (BTC) Bulls Defend the $100K Support?
In This News
Coins

$ 62.80K
-0.15%
$ 0.0649
+1.22%
$ 1.85K
-0.96%
$ 0.99901
0%
$ 0.00...361


Predictions Markets
See what traders are focused on
Share:
In This News
Coins
$ 62.80K
-0.15%$ 0.0649
+1.22%$ 1.85K
-0.96%$ 0.99901
0%$ 0.00...361
Predictions Markets
See what traders are focused on
Share:
Read More

Bitcoin And Ethereum Edge Higher As Traders Watch Altcoin Rotation