Top 100 Coins
Trending Cryptos
Performance
Recently Listed
Gainers
All Categories
All Time High
Blockchains
Global Market Data
Ecosystems
Research
Rewards
Heatmaps
Drop Hunting
Alerts
Converter
Widgets
Market Data API
Futures and Options
Affiliate Program
XRP Price Stuck Under $2.00 As Markets Brace For Another Slide

Share:
XRP price failed to surpass $2.00 and is currently correcting below $1.90, trading near $1.890. A bullish flag pattern may form with support at $1.860, while resistance is identified at $1.950. A decline below the $1.860 level could lead to further losses towards $1.80.
XRP price failed to surpass $2.00 and started another decline. The price is now correcting gains and might struggle to stay above $1.860.
- XRP price started a downside correction and tested the $1.90 zone.
- The price is now trading near $1.890 and the 100-hourly Simple Moving Average.
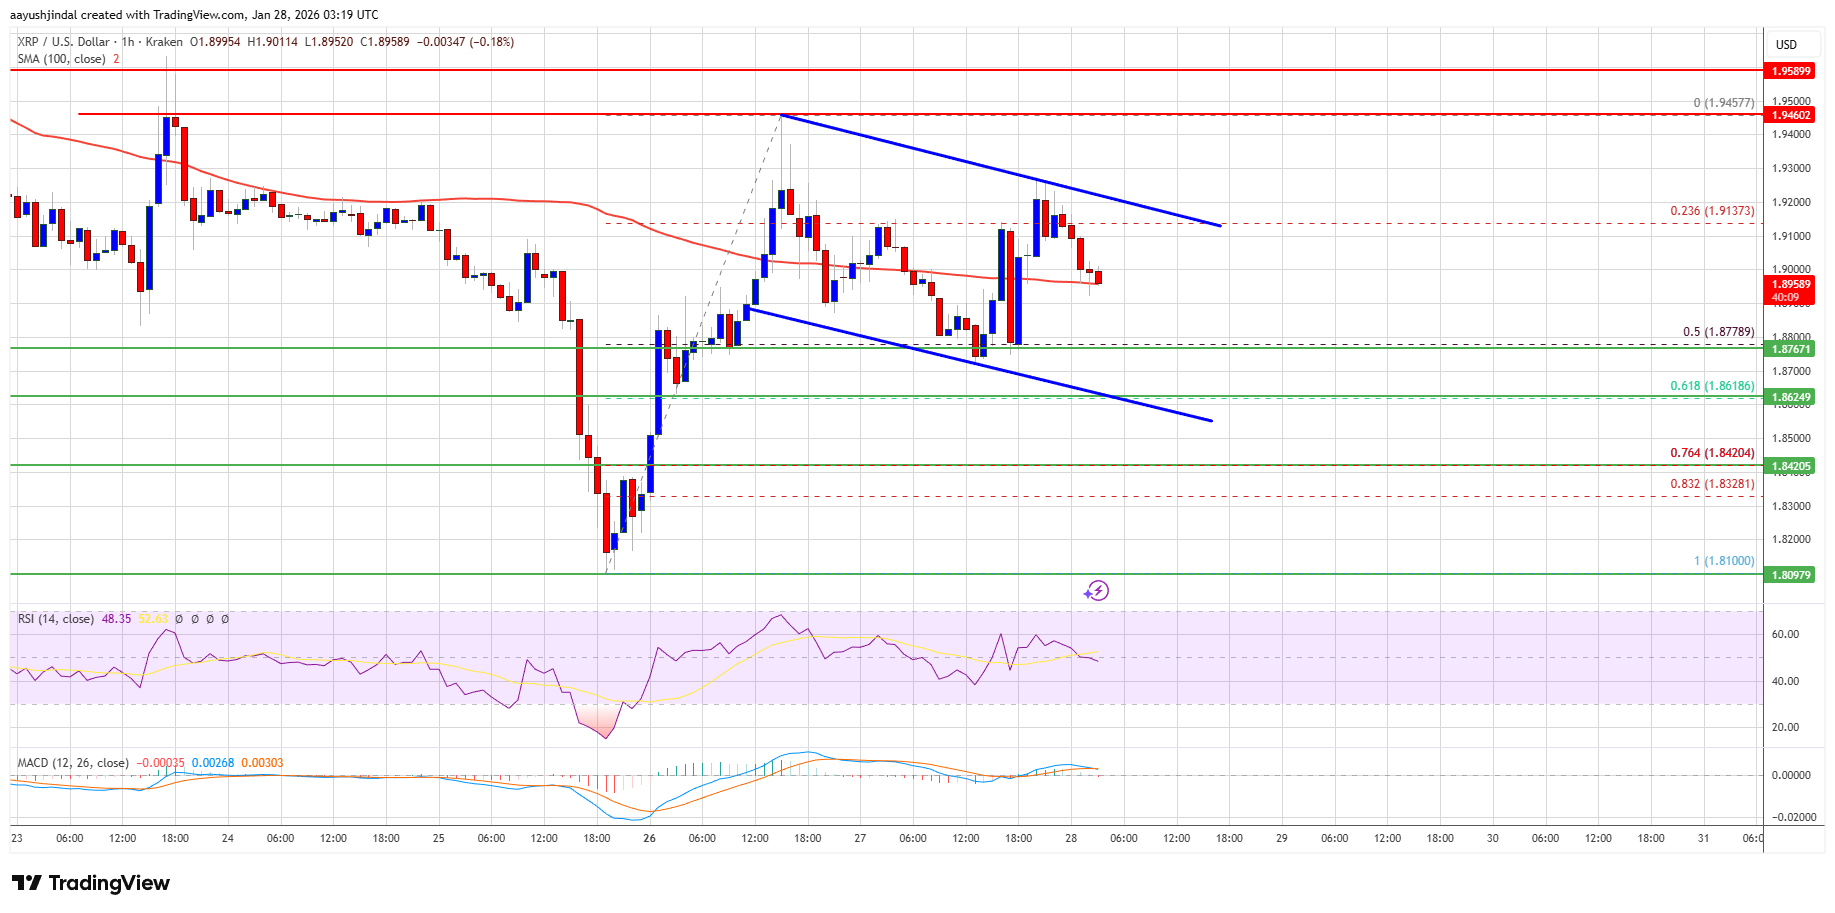
- There is a declining channel or a possible bullish flag pattern forming with support at $1.860 on the hourly chart of the XRP/USD pair (data source from Kraken).
- The pair could start another increase if it clears $1.950.
XRP Price Struggles Below $2.00
XRP price failed to clear $2.00 and started a downside correction, underperforming Bitcoin and Ethereum. The price dipped below the $1.920 and $1.90 levels to enter a negative zone.
The price even dipped below the 50% Fib retracement level of the upward move from the $1.810 swing low to the $1.945 high. The bulls are now active near $1.880. There is also a declining channel or a possible bullish flag pattern forming with support at $1.860 on the hourly chart of the XRP/USD pair.
The price is now trading near $1.890 and the 100-hourly Simple Moving Average. If there is a fresh upward move, the price might face resistance near the $1.920 level. The first major resistance is near the $1.950 level, above which the price could rise and test $2.00.
A clear move above the $2.00 resistance might send the price toward the $2.050 resistance. Any more gains might send the price toward the $2.120 resistance. The next major hurdle for the bulls might be near $2.150.
Another Decline?
If XRP fails to clear the $1.950 resistance zone, it could start a fresh decline. Initial support on the downside is near the $1.880 level. The next major support is near the $1.860 level and the 61.8% Fib retracement level of the upward move from the $1.810 swing low to the $1.945 high.
If there is a downside break and a close below the $1.860 level, the price might continue to decline toward $1.8320. The next major support sits near the $1.80 zone, below which the price could continue lower toward $1.7650.
Technical Indicators
Hourly MACD – The MACD for XRP/USD is now gaining pace in the bearish zone.
Hourly RSI (Relative Strength Index) – The RSI for XRP/USD is now below the 50 level.
Major Support Levels – $1.880 and $1.860.
Major Resistance Levels – $1.950 and $2.00.
In This News


Share:
In This News
Share:
Read More

From Extreme Fear to Glory: Is this Ripple’s XRP Next Move?

XRP Could Enter New Growth Phase After Clarity Act Decision — Here’s How
XRP Price Stuck Under $2.00 As Markets Brace For Another Slide
Share:
XRP price failed to surpass $2.00 and is currently correcting below $1.90, trading near $1.890. A bullish flag pattern may form with support at $1.860, while resistance is identified at $1.950. A decline below the $1.860 level could lead to further losses towards $1.80.
XRP price failed to surpass $2.00 and started another decline. The price is now correcting gains and might struggle to stay above $1.860.
- XRP price started a downside correction and tested the $1.90 zone.
- The price is now trading near $1.890 and the 100-hourly Simple Moving Average.
- There is a declining channel or a possible bullish flag pattern forming with support at $1.860 on the hourly chart of the XRP/USD pair (data source from Kraken).
- The pair could start another increase if it clears $1.950.
XRP Price Struggles Below $2.00
XRP price failed to clear $2.00 and started a downside correction, underperforming Bitcoin and Ethereum. The price dipped below the $1.920 and $1.90 levels to enter a negative zone.
The price even dipped below the 50% Fib retracement level of the upward move from the $1.810 swing low to the $1.945 high. The bulls are now active near $1.880. There is also a declining channel or a possible bullish flag pattern forming with support at $1.860 on the hourly chart of the XRP/USD pair.
The price is now trading near $1.890 and the 100-hourly Simple Moving Average. If there is a fresh upward move, the price might face resistance near the $1.920 level. The first major resistance is near the $1.950 level, above which the price could rise and test $2.00.
A clear move above the $2.00 resistance might send the price toward the $2.050 resistance. Any more gains might send the price toward the $2.120 resistance. The next major hurdle for the bulls might be near $2.150.
Another Decline?
If XRP fails to clear the $1.950 resistance zone, it could start a fresh decline. Initial support on the downside is near the $1.880 level. The next major support is near the $1.860 level and the 61.8% Fib retracement level of the upward move from the $1.810 swing low to the $1.945 high.
If there is a downside break and a close below the $1.860 level, the price might continue to decline toward $1.8320. The next major support sits near the $1.80 zone, below which the price could continue lower toward $1.7650.
Technical Indicators
Hourly MACD – The MACD for XRP/USD is now gaining pace in the bearish zone.
Hourly RSI (Relative Strength Index) – The RSI for XRP/USD is now below the 50 level.
Major Support Levels – $1.880 and $1.860.
Major Resistance Levels – $1.950 and $2.00.
In This News
Share:
In This News
Share:
Read More
From Extreme Fear to Glory: Is this Ripple’s XRP Next Move?