Solana (SOL) Pressured Below Key Levels, Further Drop Possible?

Share:
Solana (SOL) is currently trading below $84, indicating a bearish trend after failing to hold above $86. The price is at risk of further losses, with key support levels identified at $80 and $79. Resistance sits at $85 and $88, with potential declines toward $76.50 if downward momentum continues.
Predictions Markets
See what traders are focused on

Solana failed to stay above $86 and corrected gains. SOL price is now below $84 and remains at risk of more losses below $80.
- SOL price started a downside correction below $86 against the US Dollar.
- The price is now trading below $85 and the 100-hourly simple moving average.
- There is a bearish trend line forming with resistance at $84 on the hourly chart of the SOL/USD pair (data source from Kraken).
- The pair could extend losses if it dips below the $80 zone.
Solana Price Dips Further
Solana price failed to stay above $90 and started a downside correction, like Bitcoin and Ethereum. SOL dipped below $88 and $86 to enter a short-term bearish zone.
There was a move below the 61.8% Fib retracement level of the upward wave from the $76.55 swing low to the $91.20 high. The price even tested the $80 support. Besides, there is a bearish trend line forming with resistance at $84 on the hourly chart of the SOL/USD pair.
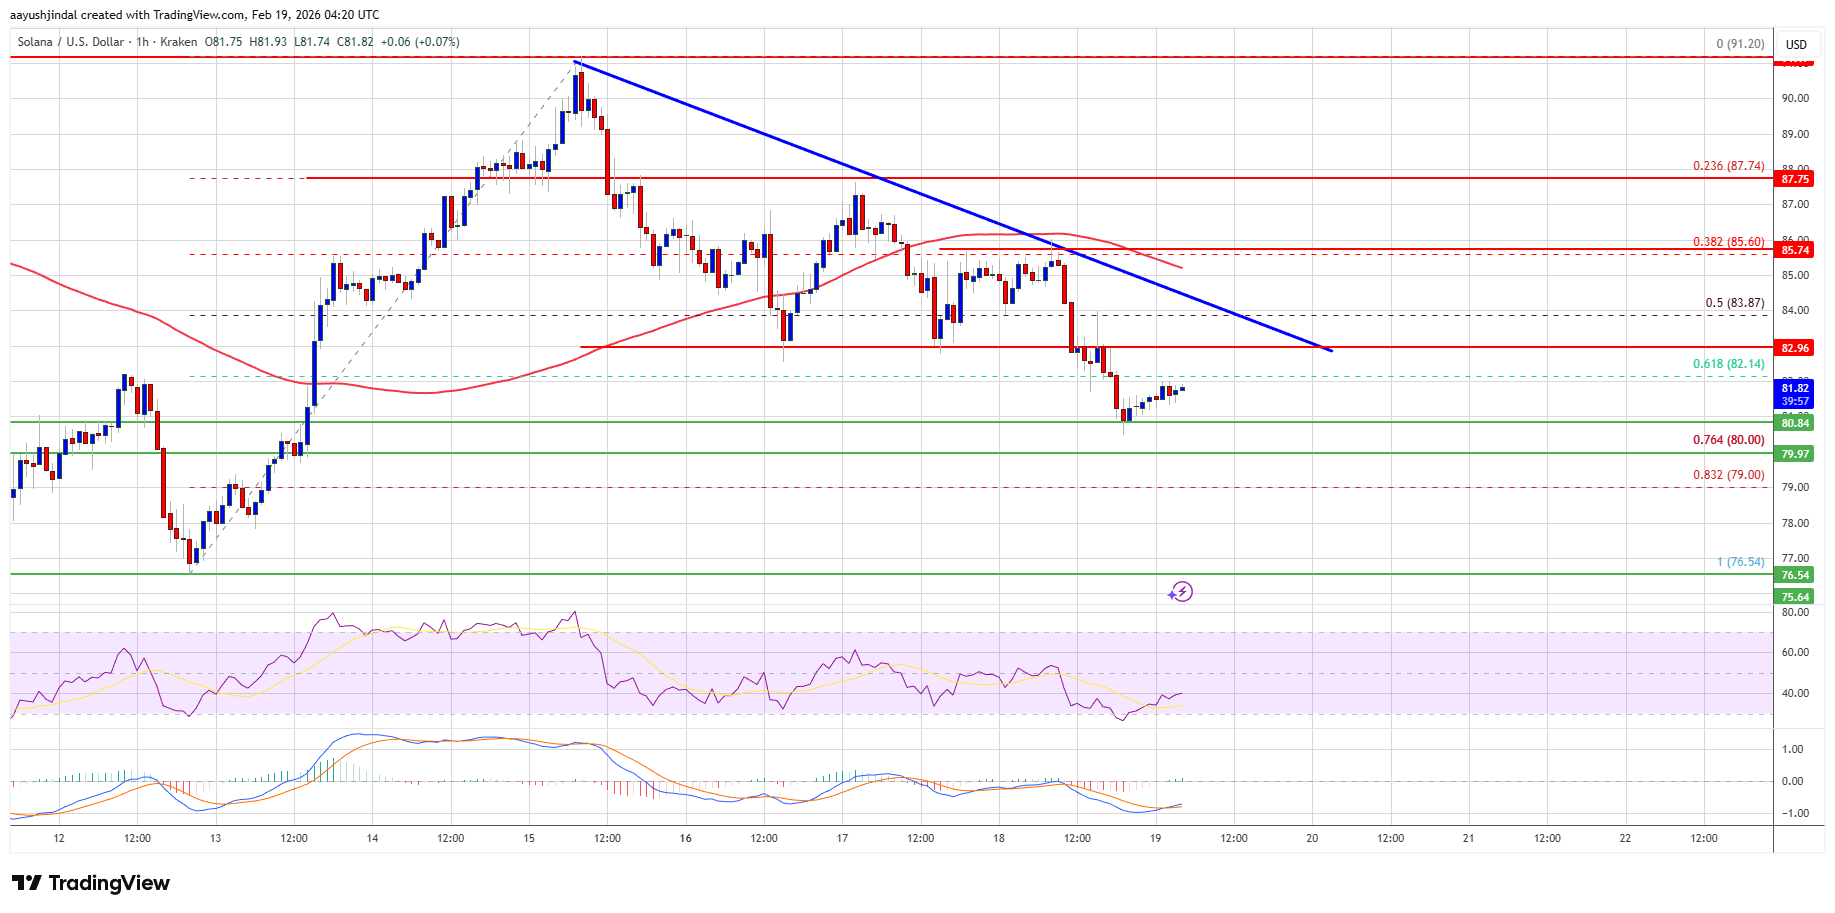
Solana is now trading below $84 and the 100-hourly simple moving average. On the upside, the price is facing resistance near the $83 level. The next major resistance is near the $84 level. The main resistance could be $85.60. A successful close above the $85.60 resistance zone could set the pace for another steady increase. The next key resistance is $88. Any more gains might send the price toward the $92 level.
More Losses In SOL?
If SOL fails to rise above the $85 resistance, it could start another decline. Initial support on the downside is near the $80 zone and the 76.4% Fib retracement level of the upward wave from the $76.55 swing low to the $91.20 high. The first major support is near the $79 level.
A break below the $79 level might send the price toward the $76.50 support zone. If there is a close below the $76.50 support, the price could decline toward the $72 support in the near term.
Technical Indicators
Hourly MACD – The MACD for SOL/USD is losing pace in the bullish zone.
Hourly Hours RSI (Relative Strength Index) – The RSI for SOL/USD is below the 50 level.
Major Support Levels – $80 and $79.
Major Resistance Levels – $85 and $88.


Read More

Ethereum Price Analysis: Key Resistance at $1,796 Could Open Path to $2,245, Says Analyst