US Dollar Index: Downside Bias Persists Within Defined Range – UOB
Chia sẻ:
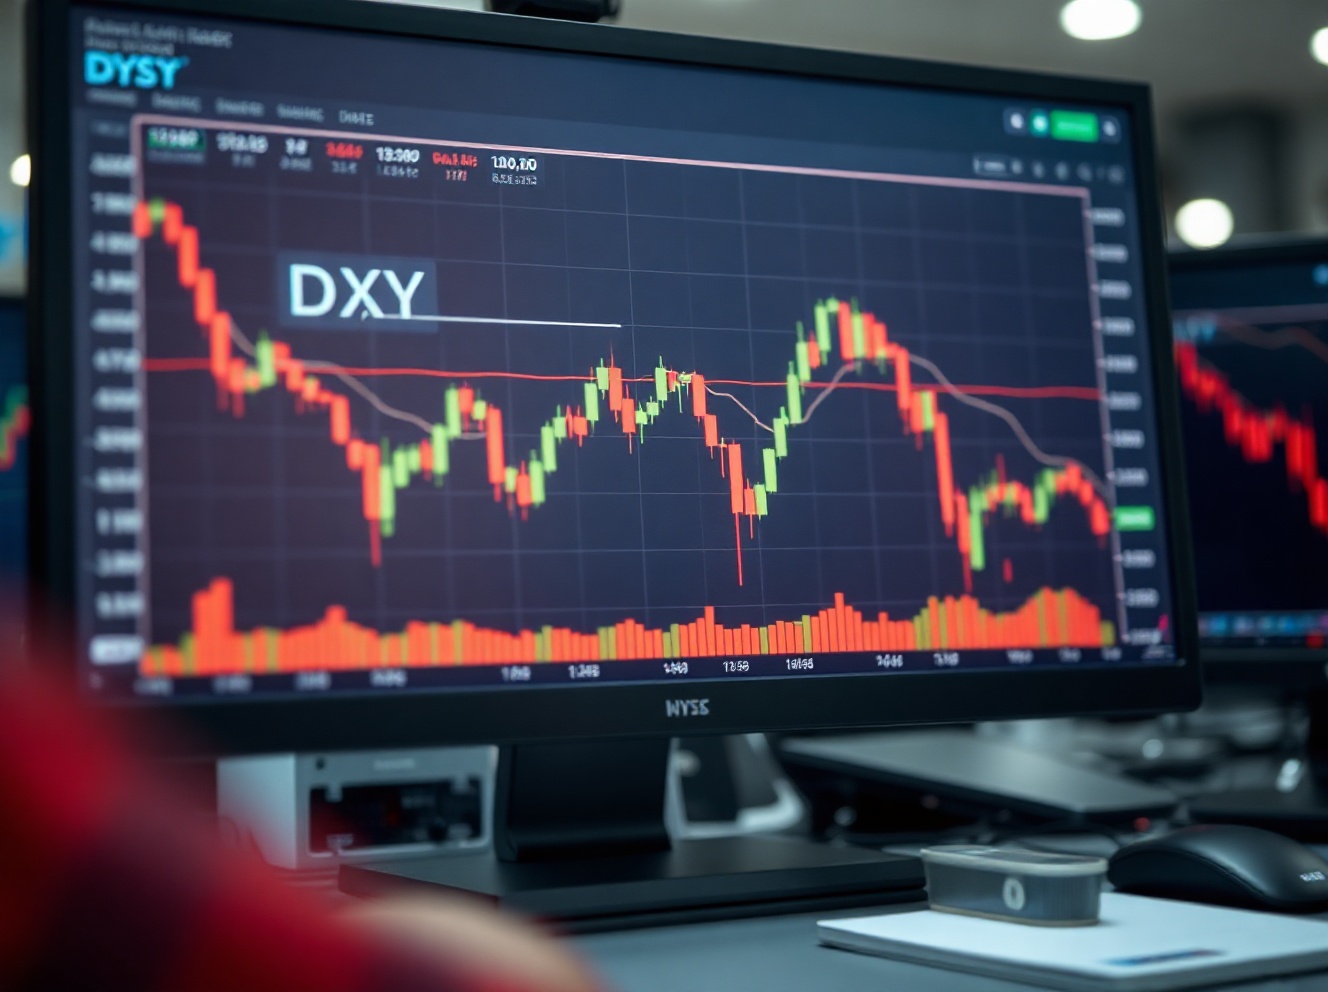
UOB says the US Dollar Index (DXY) retains a downside bias within a defined range with key support at 103.50 and resistance at 104.50; a daily close below 103.50 would target 103.00 while a sustained break above 104.50 would negate the bearish view. A softer dollar driven by Fed expectations and upcoming US economic data could support dollar-denominated commodities and risk assets, potentially boosting crypto and DeFi token performance across DEXs and CEXs, so traders should watch these levels for cross-asset and adoption impacts.
Thị trường dự đoán
Xem các trader đang tập trung vào điều gì

BitcoinWorld
US Dollar Index: Downside Bias Persists Within Defined Range – UOB
The US Dollar Index (DXY) retains a downside bias, though trading within a defined range, according to UOB Group’s latest technical analysis. As of this week, the dollar index is navigating a narrow band, with UOB flagging that any break below the lower boundary could accelerate losses.
UOB’s Technical Outlook for the Dollar Index
UOB’s FX strategists note that the DXY’s recent price action reflects a bearish tilt, but the index has not yet broken decisively below its established support zone. The bank emphasizes that as long as the index remains within the current range, the downside bias is likely to persist, but a clear break of the lower end would confirm a more significant decline.
The analysis points to key support at the 103.50 level, with resistance at 104.50. UOB advises that a daily close below 103.50 would open the door for a move toward 103.00, while a sustained move above 104.50 would negate the current bearish outlook.
Market Context and Implications
The dollar index has been under pressure recently, influenced by shifting expectations for Federal Reserve policy and global risk sentiment. A weaker dollar can have broad implications for commodities, emerging market currencies, and international trade competitiveness.
Investors are closely watching upcoming U.S. economic data, including inflation figures and employment reports, for clues on the Fed’s next move. A dovish Fed stance could further weigh on the dollar, while stronger-than-expected data might provide temporary support.
Why This Matters for Traders
For forex traders and investors, UOB’s analysis offers a clear framework for navigating the dollar’s near-term trajectory. The defined range provides actionable levels for entry and exit, while the downside bias suggests caution for dollar bulls.
Moreover, the dollar’s direction is a critical driver for cross-asset markets, including gold, oil, and equity indices. A sustained decline in the dollar could boost dollar-denominated commodities and support non-U.S. equities, while a rebound might pressure these assets.
Conclusion
In summary, UOB’s technical view highlights a dollar index that is bearish but contained, with a break below the range likely to trigger further losses. Traders should monitor the key levels and upcoming economic data to gauge the next directional move. The current setup underscores the importance of a disciplined, level-based approach in a market that remains range-bound for now.
FAQs
Q1: What is the US Dollar Index (DXY)?
The US Dollar Index measures the value of the U.S. dollar against a basket of six major currencies: the euro, Japanese yen, British pound, Canadian dollar, Swedish krona, and Swiss franc. It is a widely used benchmark for the dollar’s overall strength in global markets.
Q2: What does ‘downside bias’ mean in technical analysis?
A downside bias indicates that the prevailing trend or momentum is bearish, meaning the asset is more likely to move lower than higher in the near term. However, it does not guarantee a decline; it simply suggests a higher probability of downward movement based on current technical indicators.
Q3: How can traders use UOB’s analysis?
Traders can use UOB’s identified support and resistance levels to set entry and exit points. For instance, a break below the support level might be used as a signal to enter short positions, while a move above resistance could indicate a trend reversal. It is essential to combine this analysis with other tools and risk management strategies.
This post US Dollar Index: Downside Bias Persists Within Defined Range – UOB first appeared on BitcoinWorld.
Thị trường dự đoán
Xem các trader đang tập trung vào điều gì
Chia sẻ:
Thị trường dự đoán
Xem các trader đang tập trung vào điều gì
Chia sẻ:
Đọc thêm
USD/JPY Rebounds After Suspected Intervention, But 200-Day SMA Caps Upside